2356 W 9th St Marion, IN 46953
West Marion NeighborhoodEstimated Value: $64,643 - $95,000
3
Beds
1
Bath
1,288
Sq Ft
$60/Sq Ft
Est. Value
About This Home
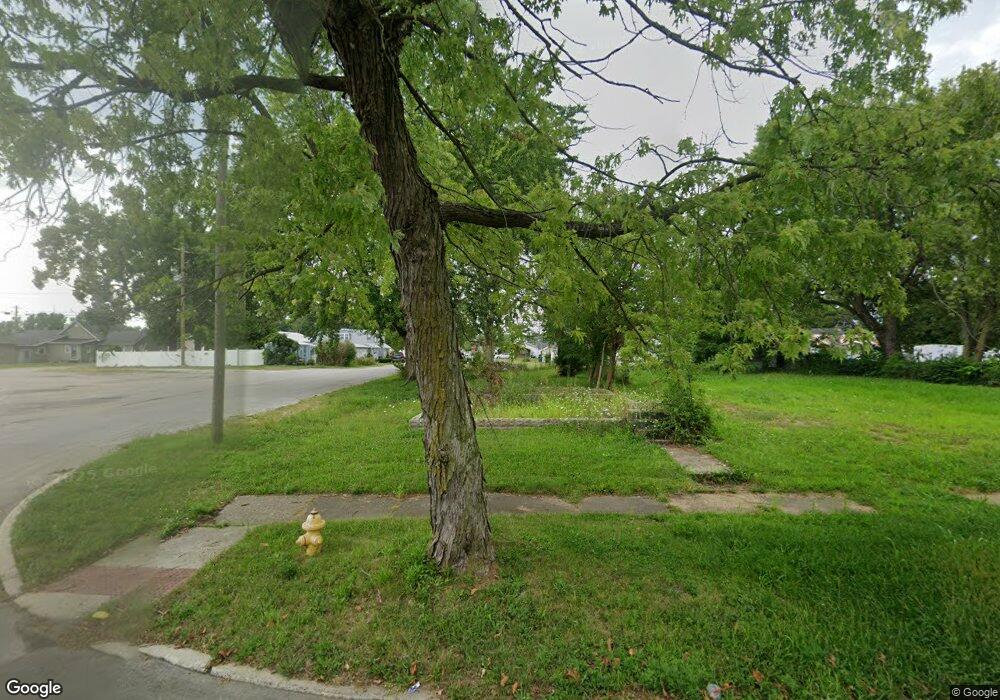
This home is located at 2356 W 9th St, Marion, IN 46953 and is currently estimated at $76,911, approximately $59 per square foot. 2356 W 9th St is a home located in Grant County with nearby schools including John W. Kendall Elementary School, Justice Thurgood Marshall Intermediate School, and John L. McCulloch Junior High School.
Ownership History
Date
Name
Owned For
Owner Type
Purchase Details
Closed on
Jun 12, 2023
Sold by
Fountain Investments Llc
Bought by
Lumaan Llc
Current Estimated Value
Purchase Details
Closed on
Sep 28, 2022
Sold by
Mcwhirt James E
Bought by
Fountain Investments Llc
Purchase Details
Closed on
Aug 27, 2008
Sold by
Perkins William G and Dollar Linda
Bought by
Perkins William G
Purchase Details
Closed on
Jul 14, 2000
Sold by
Not Provided
Bought by
Not Provided
Create a Home Valuation Report for This Property
The Home Valuation Report is an in-depth analysis detailing your home's value as well as a comparison with similar homes in the area
Home Values in the Area
Average Home Value in this Area
Purchase History
| Date | Buyer | Sale Price | Title Company |
|---|---|---|---|
| Lumaan Llc | $20,400 | None Listed On Document | |
| Fountain Investments Llc | $200 | -- | |
| Perkins William G | -- | None Available | |
| Not Provided | -- | -- |
Source: Public Records
Tax History Compared to Growth
Tax History
| Year | Tax Paid | Tax Assessment Tax Assessment Total Assessment is a certain percentage of the fair market value that is determined by local assessors to be the total taxable value of land and additions on the property. | Land | Improvement |
|---|---|---|---|---|
| 2024 | $462 | $23,100 | $4,000 | $19,100 |
| 2023 | $448 | $22,400 | $4,000 | $18,400 |
| 2022 | $428 | $21,400 | $4,000 | $17,400 |
| 2021 | $382 | $19,100 | $4,000 | $15,100 |
| 2020 | $494 | $24,700 | $4,000 | $20,700 |
| 2019 | $494 | $24,700 | $4,000 | $20,700 |
| 2018 | $538 | $26,900 | $5,300 | $21,600 |
| 2017 | $0 | $26,900 | $5,300 | $21,600 |
| 2016 | -- | $35,800 | $5,300 | $30,500 |
| 2014 | -- | $35,700 | $5,300 | $30,400 |
| 2013 | -- | $35,700 | $5,300 | $30,400 |
Source: Public Records
Map
Nearby Homes
- 2348 W 9th St
- 303 S Lenfesty Ave
- 2200 W 2nd St
- 304 N Norton Ave
- 1408 W 9th St
- 1017 S Park Ave
- 1648 Mason Blvd
- 502 N Lenfesty Ave
- 1534 W 2nd St
- 1420 W 5th St
- 1805 W Wenlock Dr
- 1512 W Spencer Ave
- 1436 W Spencer Ave
- 1146 W 6th St
- 940 N Park Ave
- 1133 W 4th St
- 1309 W 1st St
- 1136 W 3rd St
- 1108 W 6th St Unit Grant county
- 1108 W 6th St