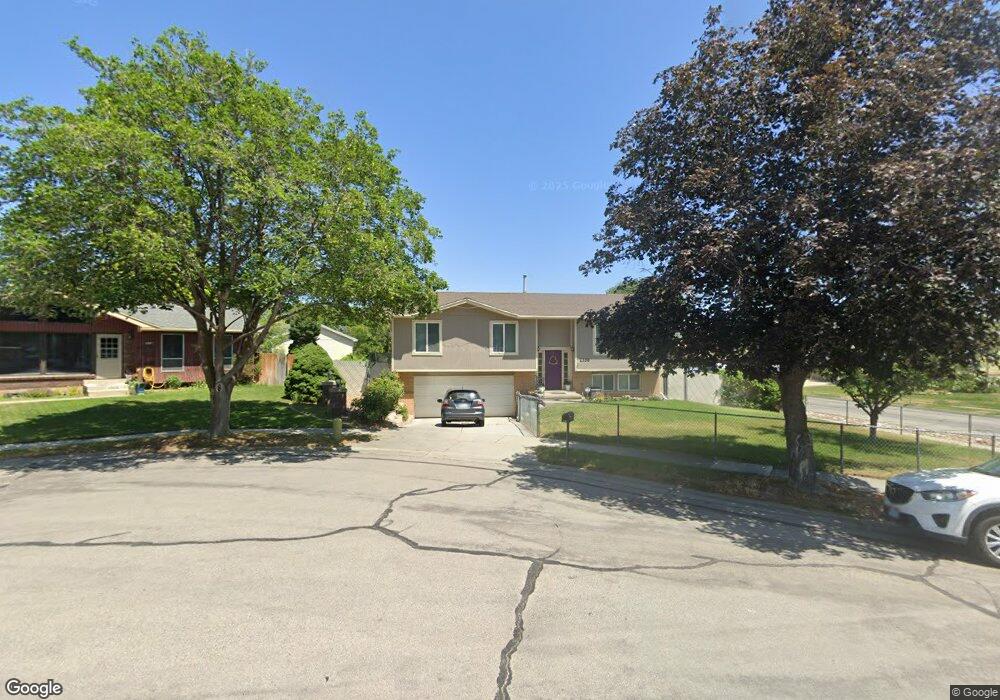
2356 W Mary Beth Cir West Jordan, UT 84084
Estimated Value: $473,702 - $503,000
3
Beds
2
Baths
1,636
Sq Ft
$295/Sq Ft
Est. Value
About This Home
This home is located at 2356 W Mary Beth Cir, West Jordan, UT 84084 and is currently estimated at $483,426, approximately $295 per square foot. 2356 W Mary Beth Cir is a home located in Salt Lake County with nearby schools including Calvin S Smith Elementary School, Bennion Junior High School, and Taylorsville High School.
Ownership History
Date
Name
Owned For
Owner Type
Purchase Details
Closed on
Jun 28, 2013
Sold by
Bailey James D and Bailey Jill M
Bought by
Bailey Jill M and Bailey James D
Current Estimated Value
Home Financials for this Owner
Home Financials are based on the most recent Mortgage that was taken out on this home.
Original Mortgage
$160,765
Outstanding Balance
$115,151
Interest Rate
3.57%
Mortgage Type
FHA
Estimated Equity
$368,275
Purchase Details
Closed on
Jun 10, 2009
Sold by
Pustyak Otmar and Pustyak Hana
Bought by
Bailey James D and Bailey Jill M
Home Financials for this Owner
Home Financials are based on the most recent Mortgage that was taken out on this home.
Original Mortgage
$162,800
Interest Rate
4.83%
Mortgage Type
FHA
Create a Home Valuation Report for This Property
The Home Valuation Report is an in-depth analysis detailing your home's value as well as a comparison with similar homes in the area
Home Values in the Area
Average Home Value in this Area
Purchase History
| Date | Buyer | Sale Price | Title Company |
|---|---|---|---|
| Bailey Jill M | -- | North American Title Llc | |
| Bailey James D | -- | First American Title |
Source: Public Records
Mortgage History
| Date | Status | Borrower | Loan Amount |
|---|---|---|---|
| Open | Bailey Jill M | $160,765 | |
| Closed | Bailey James D | $162,800 | |
| Closed | Bailey James D | $5,000 |
Source: Public Records
Tax History Compared to Growth
Tax History
| Year | Tax Paid | Tax Assessment Tax Assessment Total Assessment is a certain percentage of the fair market value that is determined by local assessors to be the total taxable value of land and additions on the property. | Land | Improvement |
|---|---|---|---|---|
| 2025 | $2,515 | $426,700 | $135,500 | $291,200 |
| 2024 | $2,515 | $412,400 | $130,900 | $281,500 |
| 2023 | $2,348 | $367,500 | $125,400 | $242,100 |
| 2022 | $2,420 | $374,700 | $122,900 | $251,800 |
| 2021 | $2,126 | $284,800 | $87,800 | $197,000 |
| 2020 | $1,868 | $249,900 | $87,800 | $162,100 |
| 2019 | $2,220 | $246,900 | $76,400 | $170,500 |
| 2018 | $1,788 | $217,300 | $76,400 | $140,900 |
| 2017 | $1,601 | $198,700 | $76,400 | $122,300 |
| 2016 | $1,482 | $182,900 | $76,400 | $106,500 |
| 2015 | $1,480 | $182,900 | $90,700 | $92,200 |
| 2014 | $1,369 | $166,200 | $83,400 | $82,800 |
Source: Public Records
Map
Nearby Homes
- 2332 Broderick Dr
- 2449 W 6385 S
- 2333 W Ledgewood Dr
- 2126 W Happiness Dr
- 2250 W Tierra Rose Dr
- 2137 W 6200 S
- 6474 Tamra Dr
- 6653 S 2200 W
- 2322 W Surrey Rd
- 6438 Mckinley Ln
- 5924 S Jordan Canal Rd
- 2337 Sharron Dr
- 6016 S Paprika Cir
- 6512 Timpanogos Way
- 2683 W Carson Ln Unit 12
- 6683 Alice Susanna Ln
- 6007 S Sweet Basil N
- 6095 S Sierra Grande Dr
- 3052 W Matterhorn Dr
- 5980 S Sweet Basil N
- 2356 Mary Beth Cir
- 2355 W Derek Cir
- 2355 Derek Cir
- 2366 Mary Beth Cir
- 6329 W Lauritzen Dr
- 2365 Derek Cir
- 2365 W Derek Cir
- 6341 Lauritzen Dr
- 6341 S Lauritzen Dr
- 6329 Lauritzen Dr
- 2373 Mary Beth Cir
- 6351 Lauritzen Dr
- 2357 Mary Beth Cir
- 2357 W Mary Beth Cir
- 6317 Lauritzen Dr
- 6317 S Lauritzen Dr
- 2367 Mary Beth Cir
- 6345 S Clara Dr
- 6345 Clara Dr
- 6355 S Clara Dr