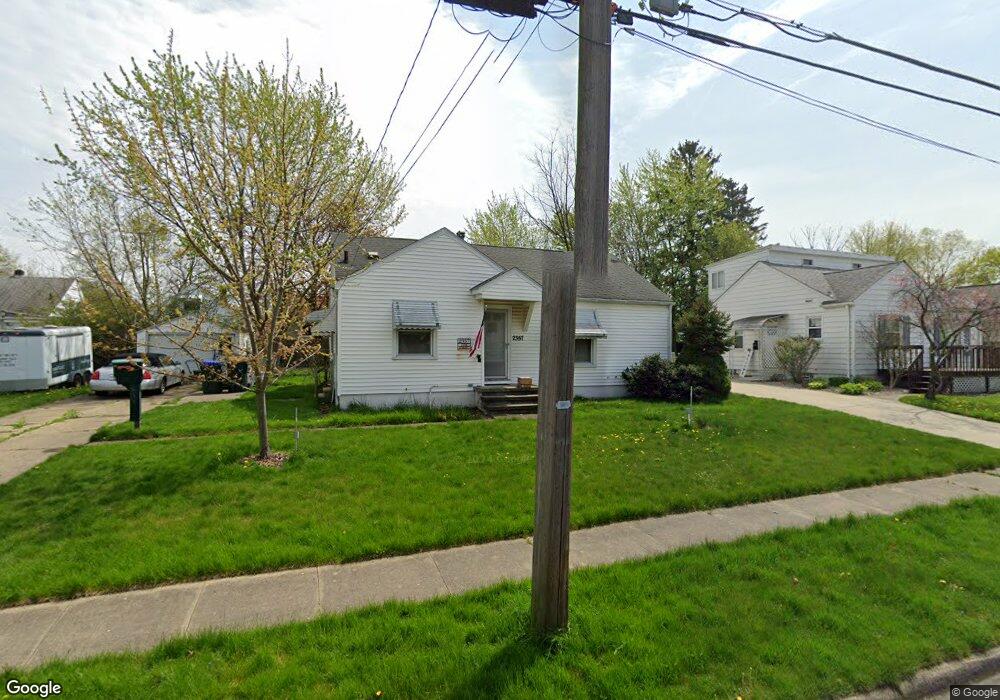
2357 11th St Cuyahoga Falls, OH 44221
Phelps Avenue NeighborhoodEstimated Value: $146,000 - $175,000
2
Beds
1
Bath
884
Sq Ft
$182/Sq Ft
Est. Value
About This Home
This home is located at 2357 11th St, Cuyahoga Falls, OH 44221 and is currently estimated at $160,940, approximately $182 per square foot. 2357 11th St is a home located in Summit County with nearby schools including Dewitt Elementary School, Bolich Middle School, and Cuyahoga Falls High School.
Ownership History
Date
Name
Owned For
Owner Type
Purchase Details
Closed on
Feb 18, 2010
Sold by
Estate Of Barbara D Putman
Bought by
Putman Gregory J
Current Estimated Value
Purchase Details
Closed on
Aug 9, 2001
Sold by
Beneficial Mtg Co Of Ohio
Bought by
Putman Gregory J and Putman Barbara D
Purchase Details
Closed on
Apr 26, 2001
Sold by
Cunningham Glenn
Bought by
Beneficial Ohio Inc and Beneficial Mtg Co Of Ohio
Create a Home Valuation Report for This Property
The Home Valuation Report is an in-depth analysis detailing your home's value as well as a comparison with similar homes in the area
Home Values in the Area
Average Home Value in this Area
Purchase History
| Date | Buyer | Sale Price | Title Company |
|---|---|---|---|
| Putman Gregory J | -- | None Available | |
| Putman Gregory J | $85,900 | Approved Statewide Title Age | |
| Beneficial Ohio Inc | -- | General Title Agency Inc |
Source: Public Records
Tax History Compared to Growth
Tax History
| Year | Tax Paid | Tax Assessment Tax Assessment Total Assessment is a certain percentage of the fair market value that is determined by local assessors to be the total taxable value of land and additions on the property. | Land | Improvement |
|---|---|---|---|---|
| 2025 | $2,728 | $49,417 | $14,473 | $34,944 |
| 2024 | $2,728 | $49,417 | $14,473 | $34,944 |
| 2023 | $2,728 | $49,417 | $14,473 | $34,944 |
| 2022 | $2,369 | $34,874 | $10,122 | $24,752 |
| 2021 | $2,369 | $34,874 | $10,122 | $24,752 |
| 2020 | $2,331 | $34,870 | $10,120 | $24,750 |
| 2019 | $2,367 | $32,260 | $9,900 | $22,360 |
| 2018 | $2,017 | $32,260 | $9,900 | $22,360 |
| 2017 | $1,995 | $32,260 | $9,900 | $22,360 |
| 2016 | $1,996 | $32,260 | $9,900 | $22,360 |
| 2015 | $1,995 | $32,260 | $9,900 | $22,360 |
| 2014 | $1,996 | $32,260 | $9,900 | $22,360 |
| 2013 | $1,983 | $32,320 | $9,900 | $22,420 |
Source: Public Records
Map
Nearby Homes