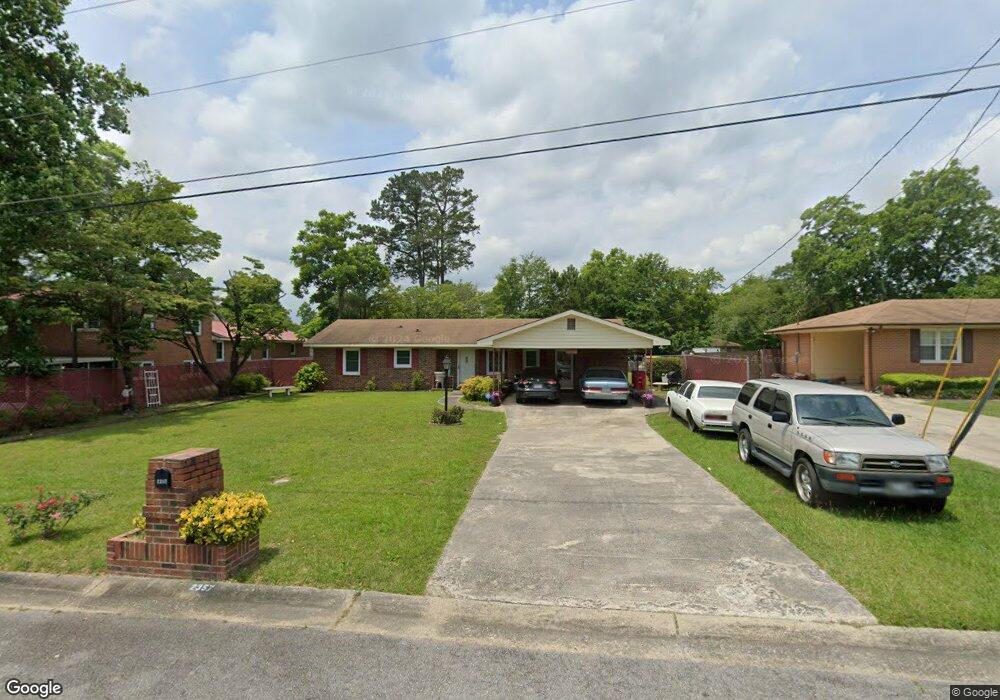
2357 Friar Ct Macon, GA 31206
Estimated Value: $131,771 - $147,000
3
Beds
3
Baths
1,819
Sq Ft
$79/Sq Ft
Est. Value
About This Home
This home is located at 2357 Friar Ct, Macon, GA 31206 and is currently estimated at $142,943, approximately $78 per square foot. 2357 Friar Ct is a home located in Bibb County with nearby schools including Veterans Elementary School, Southwest High School, and Gilead Christian Academy.
Ownership History
Date
Name
Owned For
Owner Type
Purchase Details
Closed on
Jul 8, 2009
Sold by
Hardison Lynwood W and Hardison Lynwood W
Bought by
Watson Barbara T
Current Estimated Value
Home Financials for this Owner
Home Financials are based on the most recent Mortgage that was taken out on this home.
Original Mortgage
$85,419
Outstanding Balance
$54,057
Interest Rate
4.88%
Mortgage Type
FHA
Estimated Equity
$88,886
Purchase Details
Closed on
Aug 15, 2003
Bought by
Hardison Lynwood W
Create a Home Valuation Report for This Property
The Home Valuation Report is an in-depth analysis detailing your home's value as well as a comparison with similar homes in the area
Home Values in the Area
Average Home Value in this Area
Purchase History
| Date | Buyer | Sale Price | Title Company |
|---|---|---|---|
| Watson Barbara T | $87,000 | None Available | |
| Hardison Lynwood W | -- | -- |
Source: Public Records
Mortgage History
| Date | Status | Borrower | Loan Amount |
|---|---|---|---|
| Open | Watson Barbara T | $85,419 |
Source: Public Records
Tax History Compared to Growth
Tax History
| Year | Tax Paid | Tax Assessment Tax Assessment Total Assessment is a certain percentage of the fair market value that is determined by local assessors to be the total taxable value of land and additions on the property. | Land | Improvement |
|---|---|---|---|---|
| 2025 | $1,027 | $56,382 | $3,864 | $52,518 |
| 2024 | $1,048 | $54,028 | $3,696 | $50,332 |
| 2023 | $206 | $38,900 | $1,680 | $37,220 |
| 2022 | $798 | $34,885 | $2,400 | $32,485 |
| 2021 | $1,060 | $34,885 | $2,400 | $32,485 |
| 2020 | $690 | $24,776 | $2,160 | $22,616 |
| 2019 | $764 | $26,511 | $2,160 | $24,351 |
| 2018 | $1,350 | $26,511 | $2,160 | $24,351 |
| 2017 | $731 | $26,511 | $2,160 | $24,351 |
| 2016 | $673 | $26,451 | $2,160 | $24,291 |
| 2015 | $953 | $26,451 | $2,160 | $24,291 |
| 2014 | $1,302 | $29,194 | $3,168 | $26,026 |
Source: Public Records
Map
Nearby Homes
- 2311 Lancelot Place
- 4217 Fairfax Dr
- 2431 Vivian Dr
- 2443 Lambert Dr
- 4249 Elkan Ave
- 2465 Thrasher Ave
- 2452 Thrasher Ave
- 2521 Rocky Creek Rd
- 2431 Rosen Ave
- 2455 Rosen Ave
- 4416 Elkan Ave
- 140 Spencer Hill Ct
- 3937 Lindwood Dr
- 3923 Shearwater Dr
- 3966 Mickey St
- 5770 Satterfield Dr
- 5710 Frederica Place
- 4331 Jordan Lake Rd
- 2995 Virginia Dr
- 3925 Shearwater Dr