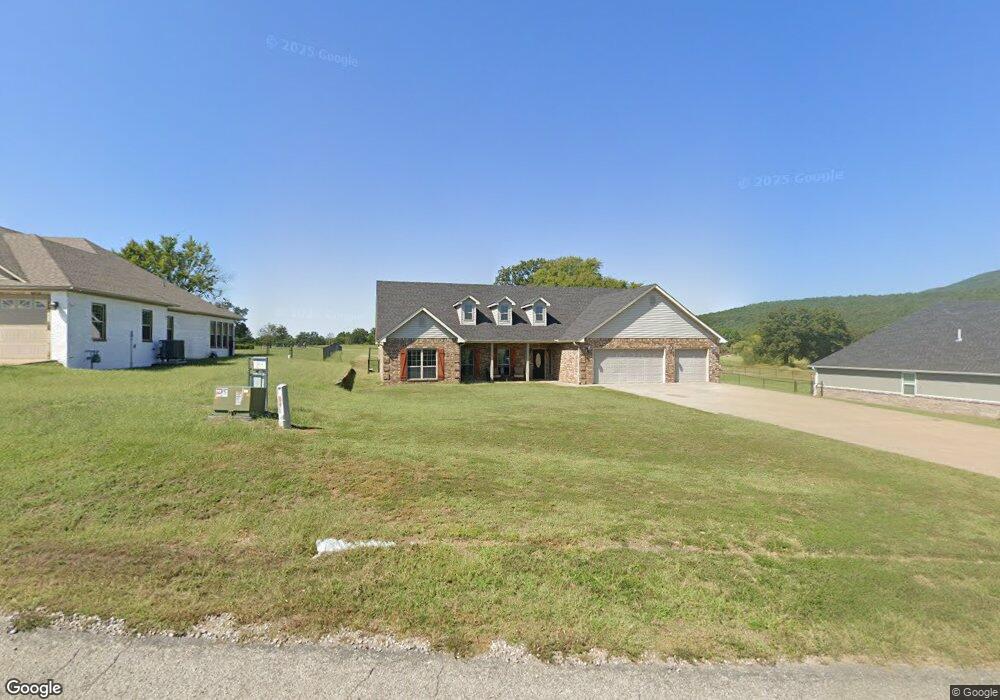
23572 Red Haven Rd Wister, OK 74966
Estimated Value: $334,783 - $387,000
3
Beds
3
Baths
2,239
Sq Ft
$161/Sq Ft
Est. Value
About This Home
This home is located at 23572 Red Haven Rd, Wister, OK 74966 and is currently estimated at $359,946, approximately $160 per square foot. 23572 Red Haven Rd is a home located in Le Flore County with nearby schools including Poteau Primary Elementary School, Poteau Upper Elementary School, and Pansy Kidd Middle School.
Ownership History
Date
Name
Owned For
Owner Type
Purchase Details
Closed on
Oct 8, 2021
Sold by
Tissington Jeremy W and Tissington Janet M
Bought by
Evans James Kaydon
Current Estimated Value
Home Financials for this Owner
Home Financials are based on the most recent Mortgage that was taken out on this home.
Original Mortgage
$304,384
Outstanding Balance
$276,967
Interest Rate
2.8%
Mortgage Type
FHA
Estimated Equity
$82,979
Purchase Details
Closed on
Sep 30, 2015
Sold by
Holt David W
Bought by
Tissington Jeremy W and Tissington Janet M
Home Financials for this Owner
Home Financials are based on the most recent Mortgage that was taken out on this home.
Original Mortgage
$185,250
Interest Rate
3.97%
Mortgage Type
New Conventional
Purchase Details
Closed on
Sep 23, 2010
Sold by
Cbf Llc
Bought by
Holt David W
Create a Home Valuation Report for This Property
The Home Valuation Report is an in-depth analysis detailing your home's value as well as a comparison with similar homes in the area
Home Values in the Area
Average Home Value in this Area
Purchase History
| Date | Buyer | Sale Price | Title Company |
|---|---|---|---|
| Evans James Kaydon | $310,000 | None Available | |
| Tissington Jeremy W | $195,000 | None Available | |
| Holt David W | $24,000 | -- |
Source: Public Records
Mortgage History
| Date | Status | Borrower | Loan Amount |
|---|---|---|---|
| Open | Evans James Kaydon | $304,384 | |
| Previous Owner | Tissington Jeremy W | $185,250 |
Source: Public Records
Tax History Compared to Growth
Tax History
| Year | Tax Paid | Tax Assessment Tax Assessment Total Assessment is a certain percentage of the fair market value that is determined by local assessors to be the total taxable value of land and additions on the property. | Land | Improvement |
|---|---|---|---|---|
| 2025 | $3,048 | $33,330 | $5,953 | $27,377 |
| 2023 | $3,048 | $34,100 | $1,100 | $33,000 |
| 2022 | $3,052 | $34,100 | $1,100 | $33,000 |
| 2021 | $1,841 | $21,621 | $1,100 | $20,521 |
| 2020 | $1,792 | $20,992 | $1,100 | $19,892 |
| 2019 | $1,893 | $22,061 | $1,100 | $20,961 |
| 2018 | $1,742 | $21,419 | $1,100 | $20,319 |
| 2017 | $1,768 | $21,633 | $1,100 | $20,533 |
| 2016 | $1,771 | $21,847 | $1,100 | $20,747 |
| 2015 | $1,884 | $22,756 | $972 | $21,784 |
| 2014 | $1,842 | $22,093 | $934 | $21,159 |
Source: Public Records
Map
Nearby Homes
- 33339 Pleasant Valley Rd
- 109 AC Pleasant Valley Rd
- 33223 Preston Dr
- 34441 Berryfrost Ln
- 22535 Valley View Rd
- TBD Jacob Rd
- 34430 Berry Frost Ln
- Lot 39 Palmilla Dr
- 33868 El Dorado Ct
- 33914 El Dorado Ct
- 505 Pleasant Valley Rd
- Tract 3 Cabo Ct
- TBD Lot 79 Cabo Ct
- Tract 1 Cabo Ct
- Tract 2 Cabo Ct
- TBD Lot 78 Cabo Ct
- TBD Lot 75 Cabo Ct
- 23708 Wolf Trail
- 801 S Webb Ln
- 34667 Wolf Trail
- 23570 Wolf Valley Rd
- 23555 Wolf Valley Rd
- 23591 Wolf Valley Rd
- 23590 Wolf Valley Rd
- 23611 Wolf Valley Rd
- 23611 Wolf Valley Rd
- 23427 Paradise Dr
- TBD LOT 34 Paradise Dr
- TBD LOT 35 Paradise Dr
- TBD LOT 36 Paradise Dr
- TBD LOT 37 Paradise Dr
- TBD LOT 41 Paradise Dr
- TBD LOT 42 Paradise Dr
- TBD LOT 43 Paradise Dr
- TBD LOT 44 Paradise Dr
- TBD LOT 45 Paradise Dr
- TBD LOT 46 Paradise Dr
- TBD LOT 47 Paradise Dr
- TBD LOT 48 Paradise Dr
- TBD LOT 49 Paradise Dr