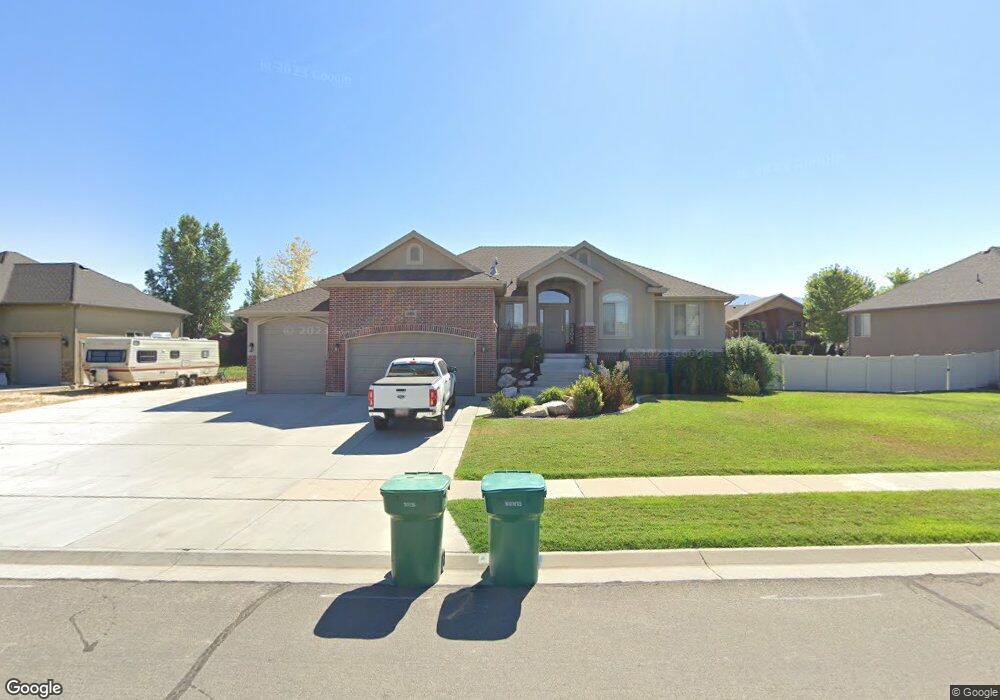
2358 S 2975 W Unit 212 West Haven, UT 84401
Estimated Value: $751,000 - $915,000
5
Beds
3
Baths
1,646
Sq Ft
$492/Sq Ft
Est. Value
About This Home
This home is located at 2358 S 2975 W Unit 212, West Haven, UT 84401 and is currently estimated at $809,432, approximately $491 per square foot. 2358 S 2975 W Unit 212 is a home located in Weber County with nearby schools including Deamude Adventist Christian School.
Ownership History
Date
Name
Owned For
Owner Type
Purchase Details
Closed on
Jun 6, 2012
Sold by
Thompson Kevin M and Thompson Rebecca A
Bought by
Taylor Kelly D and Taylor Patty
Current Estimated Value
Home Financials for this Owner
Home Financials are based on the most recent Mortgage that was taken out on this home.
Original Mortgage
$292,000
Outstanding Balance
$200,392
Interest Rate
3.37%
Mortgage Type
Construction
Estimated Equity
$609,040
Purchase Details
Closed on
Feb 4, 2009
Sold by
Jmr Leasing Llc
Bought by
Thompson Alan W and Thompson Kevin M
Purchase Details
Closed on
Mar 31, 2008
Sold by
Jmr Development Llc
Bought by
Jmr Leasing Llc
Purchase Details
Closed on
Aug 8, 2006
Sold by
M & D Developers Llc
Bought by
Jmr Development Llc
Create a Home Valuation Report for This Property
The Home Valuation Report is an in-depth analysis detailing your home's value as well as a comparison with similar homes in the area
Home Values in the Area
Average Home Value in this Area
Purchase History
| Date | Buyer | Sale Price | Title Company |
|---|---|---|---|
| Taylor Kelly D | -- | Founders Title Company Syrac | |
| Taylor Kelly D | -- | Founders Title Company | |
| Thompson Alan W | -- | Accommodation | |
| Jmr Leasing Llc | -- | Accommodation | |
| Jmr Development Llc | -- | Heritage West |
Source: Public Records
Mortgage History
| Date | Status | Borrower | Loan Amount |
|---|---|---|---|
| Open | Taylor Kelly D | $292,000 |
Source: Public Records
Tax History Compared to Growth
Tax History
| Year | Tax Paid | Tax Assessment Tax Assessment Total Assessment is a certain percentage of the fair market value that is determined by local assessors to be the total taxable value of land and additions on the property. | Land | Improvement |
|---|---|---|---|---|
| 2025 | $4,623 | $791,965 | $219,370 | $572,595 |
| 2024 | $4,427 | $427,898 | $120,653 | $307,245 |
| 2023 | $4,650 | $450,450 | $120,693 | $329,757 |
| 2022 | $4,791 | $476,850 | $109,743 | $367,107 |
| 2021 | $3,332 | $553,000 | $129,616 | $423,384 |
| 2020 | $3,134 | $476,000 | $94,639 | $381,361 |
| 2019 | $2,966 | $425,000 | $94,691 | $330,309 |
| 2018 | $2,972 | $408,000 | $84,654 | $323,346 |
| 2017 | $2,826 | $377,000 | $84,742 | $292,258 |
| 2016 | $2,725 | $196,725 | $42,749 | $153,976 |
| 2015 | $2,736 | $196,725 | $42,749 | $153,976 |
| 2014 | $2,432 | $169,824 | $34,757 | $135,067 |
Source: Public Records
Map
Nearby Homes
- 2954 W 2325 S
- 3672 3125 W Unit 12
- 2599 S 3075 W
- 3328 W 2100 S
- 2878 2850 S
- 2611 W 1850 S
- 1882 S 2475 W
- 2300 Farmhouse Select Plan at Fairhaven
- 1856 S 2425 W
- 1918 S 2475 W
- 1903 S 2425 W
- 1977 S 2425 W
- 2067 S 2425 W
- 2050 Farmhouse Select Plan at Fairhaven
- 1869 S 2425 W
- 1944 S 2425 W
- 3000 Farmhouse Select Plan at Fairhaven
- 2837 W 2875 S
- 2869 S 2700 W
- 2307 W 2525 S
- 2358 S 2975 W
- 2348 S 2975 W
- 2348 S 2975 W Unit 211
- 2355 S 2975 W
- 2368 S 2975 W
- 2368 S 2975 W Unit 213
- 2371 S 2975 W
- 2357 S Cameron Dr
- 2385 S 2975 W
- 2345 S 2975 W
- 2357 S 2950 W
- 2367 S Cameron Dr
- 2367 S 2950 W Unit 206
- 2336 S 2975 W
- 2953 W 2325 S
- 2347 S 2950 W
- 2357 Cameron Dr
- 2333 S Cameron Dr
- 2333 S Cameron Dr
- 2347 Cameron Dr