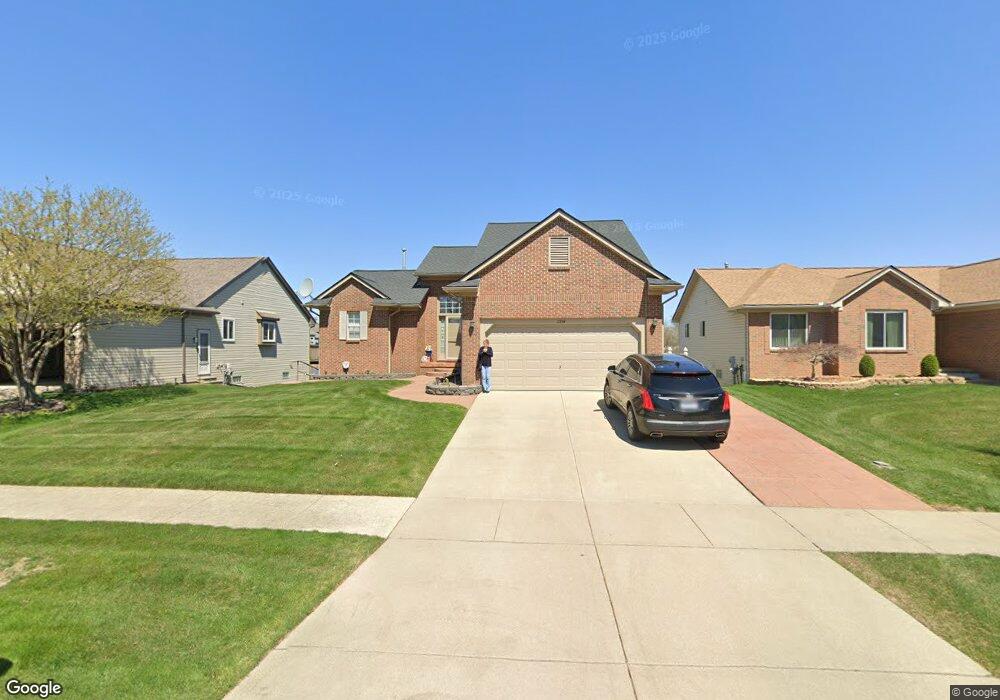
2359 Barclay Ave Unit 18 Shelby Township, MI 48317
Estimated Value: $335,000 - $389,000
3
Beds
3
Baths
1,700
Sq Ft
$208/Sq Ft
Est. Value
About This Home
This home is located at 2359 Barclay Ave Unit 18, Shelby Township, MI 48317 and is currently estimated at $353,345, approximately $207 per square foot. 2359 Barclay Ave Unit 18 is a home located in Macomb County with nearby schools including Roberts Elementary School, Eppler Junior High School, and Utica High School.
Ownership History
Date
Name
Owned For
Owner Type
Purchase Details
Closed on
Jul 7, 2011
Sold by
Kada Ghassan
Bought by
Kada Ghassan and Kada Sally
Current Estimated Value
Purchase Details
Closed on
Aug 20, 2010
Sold by
Louie Jibiraei Azhar and Louie George
Bought by
Federal Home Loan Mortgage Corp
Purchase Details
Closed on
Mar 20, 2007
Sold by
Youkhanna Faiez and Youkhanna George Dunia
Bought by
George Louie and Jibiraei Azhar
Home Financials for this Owner
Home Financials are based on the most recent Mortgage that was taken out on this home.
Original Mortgage
$240,000
Interest Rate
6.25%
Mortgage Type
Purchase Money Mortgage
Purchase Details
Closed on
Jul 8, 2005
Sold by
Youkhanna Faiez and Youkhanna George Dunia
Bought by
Youkhanna Faiez and Youkhanna George Dunia
Purchase Details
Closed on
Apr 22, 2005
Sold by
Wattles Square Inc
Bought by
Youkhanna Faiez
Create a Home Valuation Report for This Property
The Home Valuation Report is an in-depth analysis detailing your home's value as well as a comparison with similar homes in the area
Home Values in the Area
Average Home Value in this Area
Purchase History
| Date | Buyer | Sale Price | Title Company |
|---|---|---|---|
| Kada Ghassan | -- | None Available | |
| Federal Home Loan Mortgage Corp | $277,927 | None Available | |
| George Louie | -- | General Title Agency | |
| Youkhanna Faiez | -- | None Available | |
| Youkhanna Faiez | $88,000 | Metropolitan |
Source: Public Records
Mortgage History
| Date | Status | Borrower | Loan Amount |
|---|---|---|---|
| Previous Owner | George Louie | $240,000 |
Source: Public Records
Tax History Compared to Growth
Tax History
| Year | Tax Paid | Tax Assessment Tax Assessment Total Assessment is a certain percentage of the fair market value that is determined by local assessors to be the total taxable value of land and additions on the property. | Land | Improvement |
|---|---|---|---|---|
| 2025 | $4,017 | $165,100 | $0 | $0 |
| 2024 | $2,378 | $156,700 | $0 | $0 |
| 2023 | $2,252 | $144,000 | $0 | $0 |
| 2022 | $3,632 | $137,500 | $0 | $0 |
| 2021 | $3,533 | $136,500 | $0 | $0 |
| 2020 | $2,073 | $136,200 | $0 | $0 |
| 2019 | $3,234 | $130,100 | $0 | $0 |
| 2018 | $3,196 | $135,400 | $0 | $0 |
| 2017 | $3,138 | $131,150 | $26,550 | $104,600 |
| 2016 | $3,115 | $131,150 | $0 | $0 |
| 2015 | $3,070 | $122,250 | $0 | $0 |
| 2013 | $3,448 | $105,700 | $0 | $0 |
Source: Public Records
Map
Nearby Homes
- 2470 Durham Rd
- 2100 Collins Ave
- 2374 Lee Ave
- 2084 Leighton Dr Unit 23
- 2165 Leighton Dr
- 2053 Marmoor Dr
- 48571 Lakeview E
- 48574 Lakeview E
- 48575 Sandifer Ct
- 46721 Dequindre Rd
- 2986 Hessel Ave
- 48593 Lakeview E
- 48593 Sandifer Ct
- 48596 Leafdale Ct Unit 178
- 2333 Longview Ave
- 1760 E Auburn Rd Unit 301
- 1760 E Auburn Rd Unit 202
- 2580 Longview Ave
- 46419 Huling St
- Vacant Willowood Dr
- 2373 Barclay Ave Unit 17
- 2335 Barclay Ave
- 2397 Barclay Ave
- 2322 Barclay Ave
- 2421 Barclay Ave
- 2366 Barclay Ave
- 2287 Barclay Ave
- 2392 Barclay Ave
- 2404 Barclay Ave
- 47550 Schimmel Ave
- 2263 Barclay Ave Unit 22
- 2218 Barclay Ave
- 2414 Barclay Ave
- 2445 Barclay Ave
- 2239 Barclay Ave
- 2218 Crichton Ct
- 2140 Crichton Ct
- 2116 Crichton Ct
- 2192 Crichton Ct
- 2068 Crichton Ct