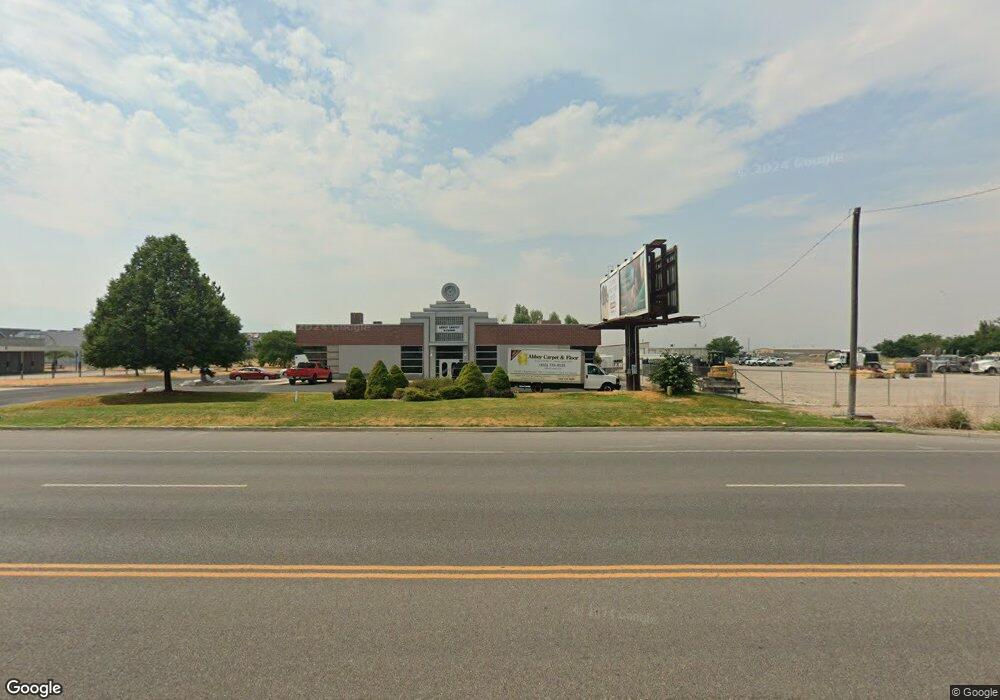
2359 N Main St Unit 1 North Logan, UT 84341
Estimated Value: $1,165,000
--
Bed
--
Bath
14,872
Sq Ft
$78/Sq Ft
Est. Value
About This Home
This home is located at 2359 N Main St Unit 1, North Logan, UT 84341 and is currently priced at $1,165,000, approximately $78 per square foot. 2359 N Main St Unit 1 is a home located in Cache County with nearby schools including Greenville School, Cedar Ridge School, and Cedar Ridge Middle School.
Ownership History
Date
Name
Owned For
Owner Type
Purchase Details
Closed on
Dec 23, 2020
Sold by
Prime Alliance Bank Inc
Bought by
Falslev Investment Property Llc
Current Estimated Value
Home Financials for this Owner
Home Financials are based on the most recent Mortgage that was taken out on this home.
Original Mortgage
$1,248,300
Outstanding Balance
$1,110,810
Interest Rate
2.8%
Mortgage Type
Purchase Money Mortgage
Purchase Details
Closed on
Dec 9, 2019
Sold by
Allenbach Brent H and Allenbach Laurie A
Bought by
Prime Alliance Bank Inc
Purchase Details
Closed on
Oct 23, 2014
Sold by
Larooba Llc
Bought by
Allenbach Brent H and Allenbach Laurie A
Home Financials for this Owner
Home Financials are based on the most recent Mortgage that was taken out on this home.
Original Mortgage
$375,000
Interest Rate
4.1%
Mortgage Type
Commercial
Purchase Details
Closed on
Feb 19, 2008
Sold by
Jlt Investments Lc
Bought by
Larooba Llc
Home Financials for this Owner
Home Financials are based on the most recent Mortgage that was taken out on this home.
Original Mortgage
$2,935,390
Interest Rate
6.04%
Mortgage Type
Commercial
Purchase Details
Closed on
May 2, 2002
Sold by
Merrill Plaza Llc
Bought by
Jlt Investments Llc
Create a Home Valuation Report for This Property
The Home Valuation Report is an in-depth analysis detailing your home's value as well as a comparison with similar homes in the area
Home Values in the Area
Average Home Value in this Area
Purchase History
| Date | Buyer | Sale Price | Title Company |
|---|---|---|---|
| Falslev Investment Property Llc | -- | Northern Title Company | |
| Prime Alliance Bank Inc | -- | None Available | |
| Allenbach Brent H | -- | Mountain View Title | |
| Larooba Llc | -- | Bonneville Superior Title | |
| Jlt Investments Llc | -- | Cache Title Company |
Source: Public Records
Mortgage History
| Date | Status | Borrower | Loan Amount |
|---|---|---|---|
| Open | Falslev Investment Property Llc | $1,248,300 | |
| Previous Owner | Allenbach Brent H | $375,000 | |
| Previous Owner | Larooba Llc | $2,935,390 |
Source: Public Records
Tax History Compared to Growth
Tax History
| Year | Tax Paid | Tax Assessment Tax Assessment Total Assessment is a certain percentage of the fair market value that is determined by local assessors to be the total taxable value of land and additions on the property. | Land | Improvement |
|---|---|---|---|---|
| 2025 | $12,567 | $1,594,230 | $358,412 | $1,235,818 |
| 2024 | $1,157 | $1,423,906 | $389,866 | $1,034,040 |
| 2023 | $12,035 | $1,405,341 | $371,301 | $1,034,040 |
| 2022 | $12,683 | $1,387,660 | $353,620 | $1,034,040 |
| 2021 | $14,273 | $1,338,420 | $353,620 | $984,800 |
| 2020 | $15,807 | $1,338,420 | $353,620 | $984,800 |
| 2019 | $15,456 | $1,283,420 | $353,620 | $929,800 |
| 2018 | $17,018 | $1,300,060 | $370,260 | $929,800 |
| 2017 | $17,611 | $1,300,060 | $0 | $0 |
| 2016 | $18,193 | $1,300,060 | $0 | $0 |
| 2015 | $18,378 | $1,300,060 | $0 | $0 |
| 2014 | $15,283 | $1,193,905 | $0 | $0 |
| 2013 | -- | $1,199,400 | $0 | $0 |
Source: Public Records
Map
Nearby Homes
- 2189 N 200 W
- 153 E 2440 N Unit 7
- 2070 U S 91
- 2452 N 200 E
- 242 E 2230 N Unit A
- 490 W 1950 N Unit 27
- 327 E 2230 N Unit A
- 2807 N Main St
- 385 E 2280 N Unit D
- 2592 N 330 E
- 449 E 2170 N
- 2700 N 300 E
- 259 W 1800 N
- 85 Hampton Place
- 1926 Lavender Loop Unit 6
- 48 Kensington Place
- 2 Somerset Place
- Prescott Plan at Smiling H Ranch
- Somerley Plan at Smiling H Ranch
- Viewside Plan at Smiling H Ranch
- 2359 N Main St
- 2355 N Main St
- 2281 N Main St
- 2297 N Main St Unit 3
- 1800 W 2400 N
- 2350 N Main St Unit BLDG 1
- 2350 N Main St Unit 4
- 2350 N Main St Unit 3
- 2350 N Main St Unit 4B
- 2350 N Main St Unit 4A
- 2350 N Main Build #1 St Unit 1
- 2300 N Main St
- 2424 N Main St
- 2440 N Main St
- 153 W 2300 N
- 157 W 2300 N
- 159 W 2300 N
- 163 W 2300 N
- 90 W 2500 N
- 2250 N Main St