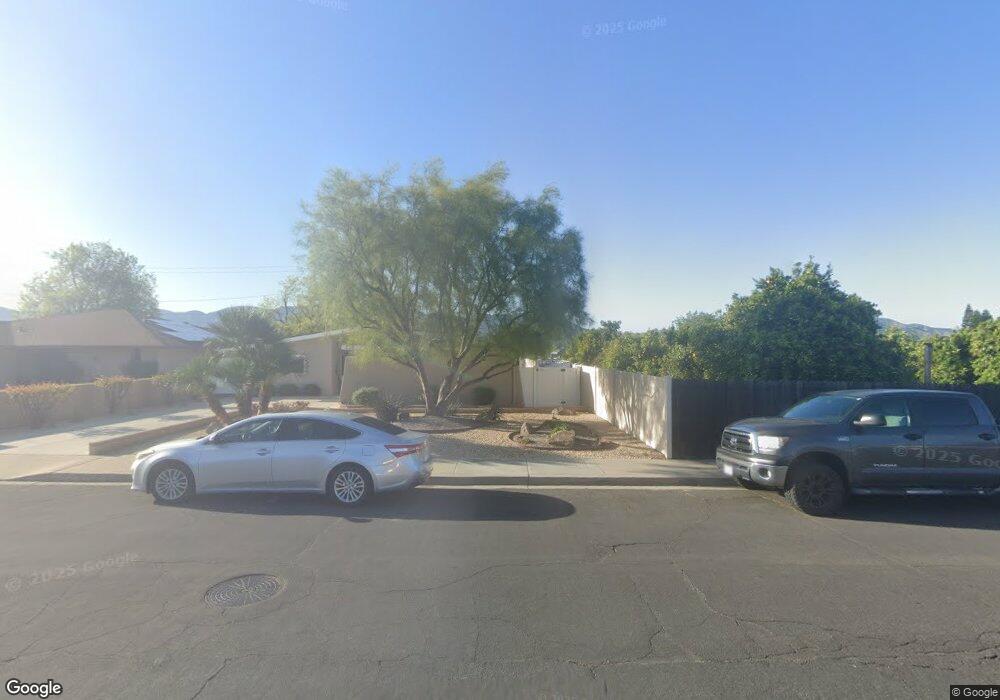
236 2nd St Fillmore, CA 93015
Estimated Value: $635,000 - $769,065
3
Beds
2
Baths
1,718
Sq Ft
$424/Sq Ft
Est. Value
About This Home
This home is located at 236 2nd St, Fillmore, CA 93015 and is currently estimated at $728,766, approximately $424 per square foot. 236 2nd St is a home located in Ventura County with nearby schools including San Cayetano Elementary School and Fillmore Senior High.
Ownership History
Date
Name
Owned For
Owner Type
Purchase Details
Closed on
May 19, 2018
Sold by
Ramos John and Ramos Carol A
Bought by
Ramos John and Ramos Carol A
Current Estimated Value
Create a Home Valuation Report for This Property
The Home Valuation Report is an in-depth analysis detailing your home's value as well as a comparison with similar homes in the area
Home Values in the Area
Average Home Value in this Area
Purchase History
| Date | Buyer | Sale Price | Title Company |
|---|---|---|---|
| Ramos John | -- | None Available |
Source: Public Records
Tax History
| Year | Tax Paid | Tax Assessment Tax Assessment Total Assessment is a certain percentage of the fair market value that is determined by local assessors to be the total taxable value of land and additions on the property. | Land | Improvement |
|---|---|---|---|---|
| 2025 | $4,452 | $407,951 | $243,943 | $164,008 |
| 2024 | $4,452 | $399,952 | $239,159 | $160,793 |
| 2023 | $4,390 | $392,110 | $234,469 | $157,641 |
| 2022 | $4,057 | $384,422 | $229,872 | $154,550 |
| 2021 | $4,614 | $376,885 | $225,365 | $151,520 |
| 2020 | $4,278 | $373,022 | $223,055 | $149,967 |
| 2019 | $4,290 | $365,709 | $218,682 | $147,027 |
| 2018 | $4,202 | $358,540 | $214,395 | $144,145 |
| 2017 | $4,225 | $351,511 | $210,192 | $141,319 |
| 2016 | $3,910 | $344,620 | $206,071 | $138,549 |
| 2015 | $3,800 | $339,446 | $202,977 | $136,469 |
| 2014 | $3,797 | $332,798 | $199,001 | $133,797 |
Source: Public Records
Map
Nearby Homes
- 616 Island View St
- 639 Mountain View St
- 318 Bard St
- 444 Mountain View St
- 345 Blaine Ave
- 300 Fillmore St
- 503 Arundell Cir
- 404 Central Ave
- 340 Central Ave
- 158 Arborwood St
- 252 Driftwood St
- 809 Woodgrove Rd
- 199 Rosewood St
- 1000 Foothill Dr
- 815 Woodgrove Rd
- 445 Edgewood Dr
- 915 E Telegraph Rd
- 250 E Telegraph Rd Unit 200
- 250 E Telegraph Rd Unit 68
- 250 E Telegraph Rd Unit 213
- 230 2nd St
- 222 2nd St
- 218 2nd St
- 602 Elkins Ln
- 603 Elkins Ln
- 608 Elkins Ln
- 212 2nd St
- 603 Island View St
- 602 Mountain View St
- 614 Elkins Ln
- 615 Elkins Ln
- 206 2nd St
- 609 Island View St
- 608 Mountain View St
- 620 Elkins Ln
- 621 Elkins Ln
- 617 Island View St
- 614 Mountain View St
- 200 2nd St
- 551 Mountain View St
Your Personal Tour Guide
Ask me questions while you tour the home.