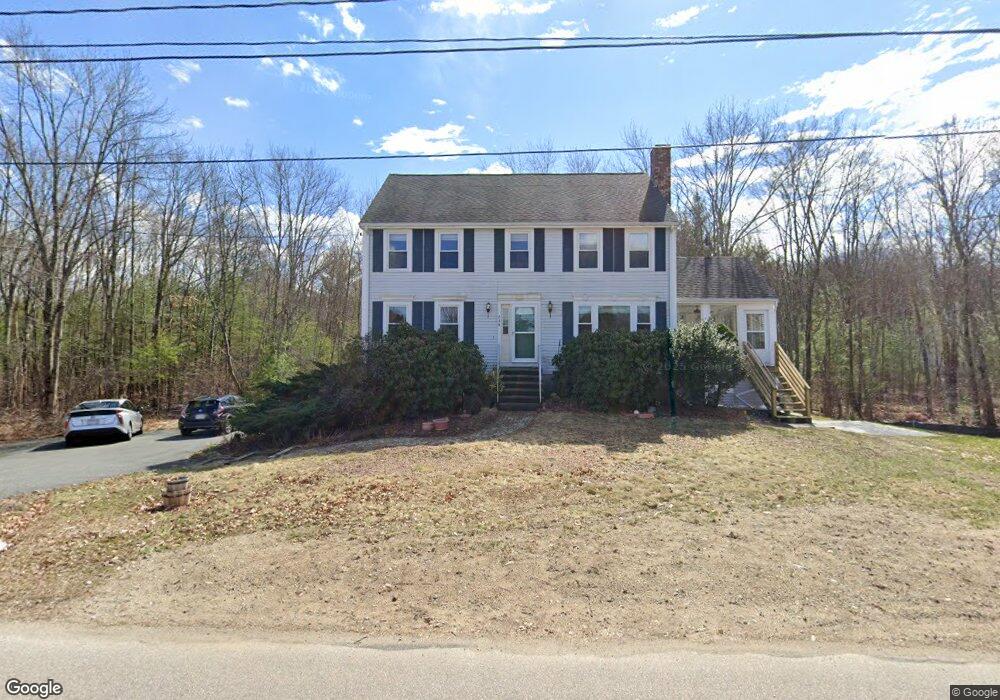
236 Curve St Millis, MA 02054
Estimated Value: $697,372 - $768,000
4
Beds
3
Baths
1,818
Sq Ft
$410/Sq Ft
Est. Value
About This Home
This home is located at 236 Curve St, Millis, MA 02054 and is currently estimated at $746,093, approximately $410 per square foot. 236 Curve St is a home located in Norfolk County with nearby schools including Clyde F Brown, Millis Middle School, and Millis High School.
Ownership History
Date
Name
Owned For
Owner Type
Purchase Details
Closed on
Sep 18, 2000
Sold by
Ledoux Theodore J and Ledoux Maribeth A
Bought by
Kalmbach Arnold T and Kalmbach Faye
Current Estimated Value
Home Financials for this Owner
Home Financials are based on the most recent Mortgage that was taken out on this home.
Original Mortgage
$244,000
Outstanding Balance
$88,740
Interest Rate
8.07%
Mortgage Type
Purchase Money Mortgage
Estimated Equity
$657,353
Create a Home Valuation Report for This Property
The Home Valuation Report is an in-depth analysis detailing your home's value as well as a comparison with similar homes in the area
Home Values in the Area
Average Home Value in this Area
Purchase History
| Date | Buyer | Sale Price | Title Company |
|---|---|---|---|
| Kalmbach Arnold T | $305,000 | -- |
Source: Public Records
Mortgage History
| Date | Status | Borrower | Loan Amount |
|---|---|---|---|
| Open | Kalmbach Arnold T | $244,000 | |
| Previous Owner | Kalmbach Arnold T | $18,000 |
Source: Public Records
Tax History
| Year | Tax Paid | Tax Assessment Tax Assessment Total Assessment is a certain percentage of the fair market value that is determined by local assessors to be the total taxable value of land and additions on the property. | Land | Improvement |
|---|---|---|---|---|
| 2025 | $9,355 | $570,400 | $213,600 | $356,800 |
| 2024 | $9,095 | $553,900 | $213,600 | $340,300 |
| 2023 | $9,018 | $515,600 | $185,800 | $329,800 |
| 2022 | $8,419 | $445,900 | $172,400 | $273,500 |
| 2021 | $8,372 | $426,700 | $172,400 | $254,300 |
| 2020 | $8,183 | $406,300 | $161,200 | $245,100 |
| 2019 | $7,349 | $393,000 | $152,000 | $241,000 |
| 2018 | $6,570 | $364,600 | $138,500 | $226,100 |
| 2017 | $6,532 | $354,600 | $150,900 | $203,700 |
| 2016 | $6,184 | $354,600 | $150,900 | $203,700 |
| 2015 | $6,028 | $354,600 | $150,900 | $203,700 |
Source: Public Records
Map
Nearby Homes
Your Personal Tour Guide
Ask me questions while you tour the home.