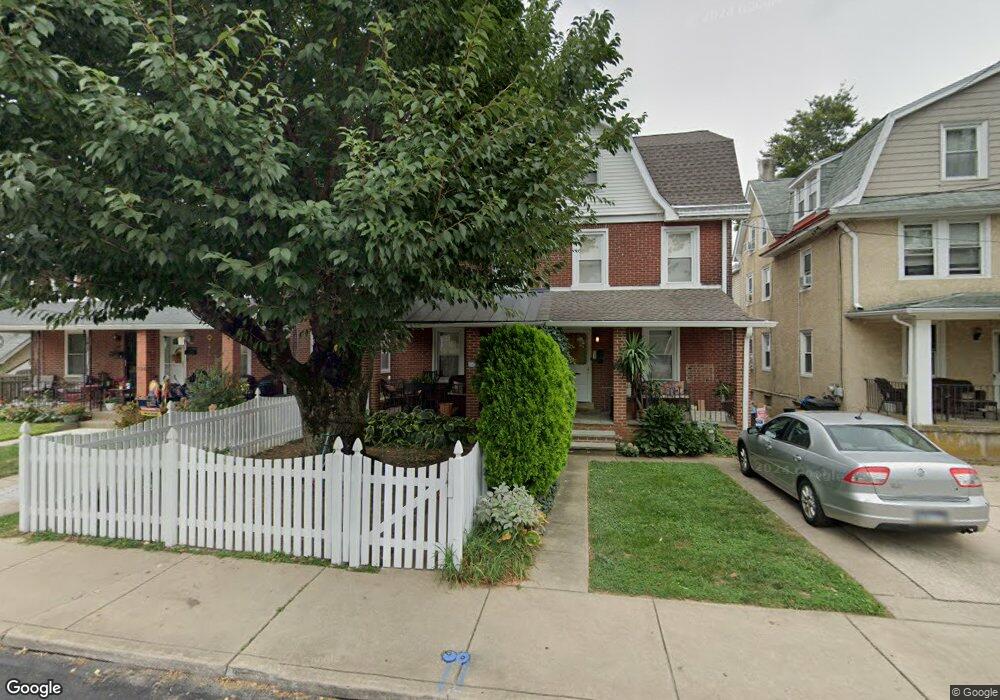
236 E Spring Ave Ardmore, PA 19003
Estimated Value: $447,882 - $530,000
5
Beds
2
Baths
1,796
Sq Ft
$279/Sq Ft
Est. Value
About This Home
This home is located at 236 E Spring Ave, Ardmore, PA 19003 and is currently estimated at $500,221, approximately $278 per square foot. 236 E Spring Ave is a home located in Montgomery County with nearby schools including Penn Valley School, Welsh Valley Middle School, and Lower Merion High School.
Ownership History
Date
Name
Owned For
Owner Type
Purchase Details
Closed on
Sep 21, 2021
Sold by
Ramirez Krista E
Bought by
Ramirez Krista Eve Wells and Carrillo Jose Angel
Current Estimated Value
Purchase Details
Closed on
Sep 30, 2010
Sold by
Watson Sean and Watson Anthony J
Bought by
Ramirez Krista E
Home Financials for this Owner
Home Financials are based on the most recent Mortgage that was taken out on this home.
Original Mortgage
$216,274
Outstanding Balance
$146,446
Interest Rate
4.87%
Mortgage Type
FHA
Estimated Equity
$353,775
Purchase Details
Closed on
Mar 30, 1994
Sold by
Kwiat Kenneth B
Bought by
Watson Anthony J
Create a Home Valuation Report for This Property
The Home Valuation Report is an in-depth analysis detailing your home's value as well as a comparison with similar homes in the area
Home Values in the Area
Average Home Value in this Area
Purchase History
| Date | Buyer | Sale Price | Title Company |
|---|---|---|---|
| Ramirez Krista Eve Wells | -- | None Available | |
| Ramirez Krista E | $181,000 | None Available | |
| Watson Anthony J | $112,000 | -- |
Source: Public Records
Mortgage History
| Date | Status | Borrower | Loan Amount |
|---|---|---|---|
| Open | Ramirez Krista E | $216,274 |
Source: Public Records
Tax History
| Year | Tax Paid | Tax Assessment Tax Assessment Total Assessment is a certain percentage of the fair market value that is determined by local assessors to be the total taxable value of land and additions on the property. | Land | Improvement |
|---|---|---|---|---|
| 2025 | $4,381 | $104,900 | $26,080 | $78,820 |
| 2024 | $4,381 | $104,900 | $26,080 | $78,820 |
| 2023 | $4,198 | $104,900 | $26,080 | $78,820 |
| 2022 | $4,120 | $104,900 | $26,080 | $78,820 |
| 2021 | $4,027 | $104,900 | $26,080 | $78,820 |
| 2020 | $3,928 | $104,900 | $26,080 | $78,820 |
| 2019 | $3,859 | $104,900 | $26,080 | $78,820 |
Source: Public Records
Map
Nearby Homes
- 2525 Olcott Ave
- 724 Loraine St
- 1504 Wynnewood Rd
- 124 Grandview Rd
- 754 Oak View Rd
- 2432 Olcott Ave
- 2757 Saint Marys Rd
- 145 Walnut Ave
- 825 Aubrey Ave
- 111 Saint Pauls Rd
- 222 Lippincott Ave
- 140 Walnut Ave
- 818 Clifford Ave
- 633 Georges Ln
- 801 Ardmore Ave
- 2471 Wynnefield Dr
- 607 Latham Dr
- 601 Georges Ln
- 700 Ardmore Ave Unit 424
- 410 E Eagle Rd
- 238 E Spring Ave
- 234 E Spring Ave
- 240 E Spring Ave
- 232 E Spring Ave Unit 66
- 205 Edgemont Ave
- 207 Edgemont Ave
- 209 Edgemont Ave
- 204 Delmont Ave
- 206 Delmont Ave
- 248 E Spring Ave
- 166 Grandview Rd
- 208 Delmont Ave
- 211 Edgemont Ave
- 164 Grandview Rd
- 212 Delmont Ave
- 213 Edgemont Ave
- 214 Delmont Ave
- 204 Edgemont Ave
- 202 Edgemont Ave Unit 900
- 162 Grandview Rd
Your Personal Tour Guide
Ask me questions while you tour the home.