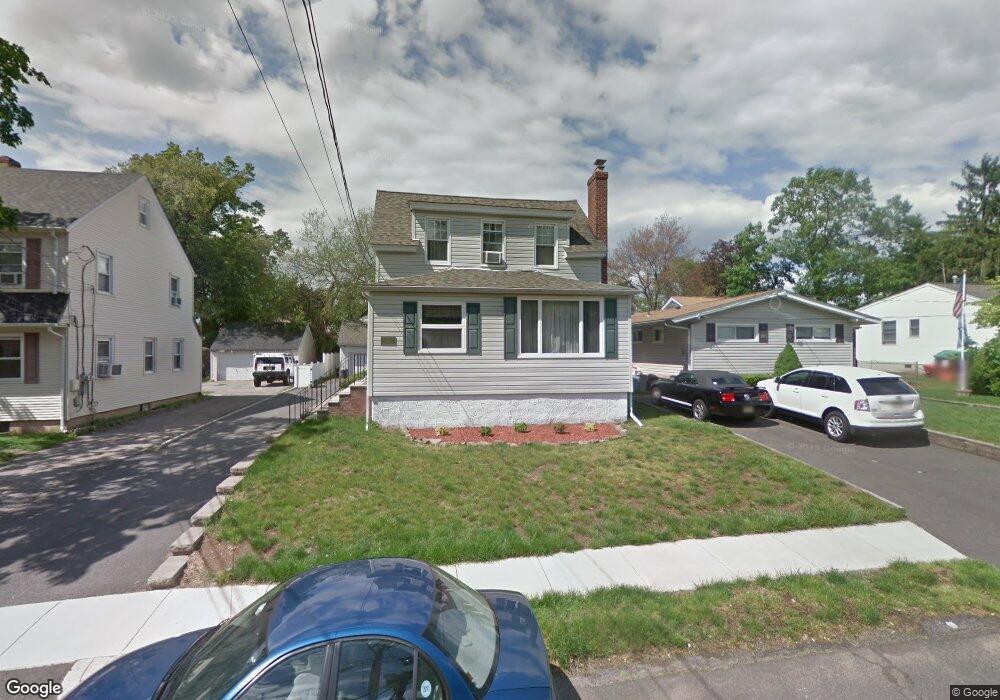
236 Larch Ave Unit 2 Dumont, NJ 07628
Estimated Value: $696,000 - $787,000
1
Bed
1
Bath
2,163
Sq Ft
$336/Sq Ft
Est. Value
About This Home
This home is located at 236 Larch Ave Unit 2, Dumont, NJ 07628 and is currently estimated at $726,922, approximately $336 per square foot. 236 Larch Ave Unit 2 is a home located in Bergen County with nearby schools including Dumont High School.
Ownership History
Date
Name
Owned For
Owner Type
Purchase Details
Closed on
Jan 15, 2020
Sold by
Consentino David
Bought by
Green James C and Green Christine M
Current Estimated Value
Home Financials for this Owner
Home Financials are based on the most recent Mortgage that was taken out on this home.
Original Mortgage
$372,000
Outstanding Balance
$329,309
Interest Rate
3.7%
Mortgage Type
New Conventional
Estimated Equity
$397,613
Purchase Details
Closed on
Oct 10, 2012
Sold by
Solari Theresa
Bought by
Consentino David
Create a Home Valuation Report for This Property
The Home Valuation Report is an in-depth analysis detailing your home's value as well as a comparison with similar homes in the area
Home Values in the Area
Average Home Value in this Area
Purchase History
| Date | Buyer | Sale Price | Title Company |
|---|---|---|---|
| Green James C | $496,000 | None Available | |
| Consentino David | $367,000 | -- |
Source: Public Records
Mortgage History
| Date | Status | Borrower | Loan Amount |
|---|---|---|---|
| Open | Green James C | $372,000 |
Source: Public Records
Tax History Compared to Growth
Tax History
| Year | Tax Paid | Tax Assessment Tax Assessment Total Assessment is a certain percentage of the fair market value that is determined by local assessors to be the total taxable value of land and additions on the property. | Land | Improvement |
|---|---|---|---|---|
| 2025 | $13,398 | $746,000 | $322,600 | $423,400 |
| 2024 | $13,069 | $329,600 | $169,700 | $159,900 |
| 2023 | $12,798 | $329,600 | $169,700 | $159,900 |
| 2022 | $12,798 | $329,600 | $169,700 | $159,900 |
| 2021 | $12,723 | $329,600 | $169,700 | $159,900 |
| 2020 | $12,390 | $329,600 | $169,700 | $159,900 |
| 2019 | $12,093 | $329,600 | $169,700 | $159,900 |
| 2018 | $11,846 | $329,600 | $169,700 | $159,900 |
| 2017 | $11,618 | $329,600 | $169,700 | $159,900 |
| 2016 | $11,348 | $329,600 | $169,700 | $159,900 |
| 2015 | $11,088 | $329,600 | $169,700 | $159,900 |
| 2014 | $10,870 | $329,600 | $169,700 | $159,900 |
Source: Public Records
Map
Nearby Homes