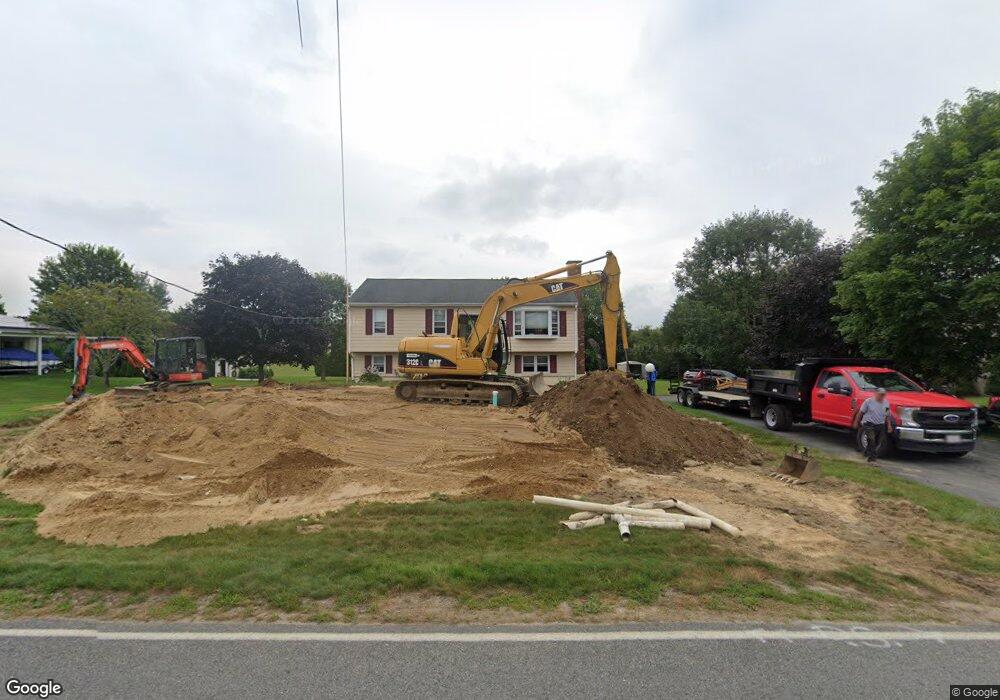
236 Leonard St Acushnet, MA 02743
Upper Acushnet NeighborhoodEstimated Value: $478,037 - $614,000
Studio
2
Baths
1,000
Sq Ft
$524/Sq Ft
Est. Value
About This Home
This home is located at 236 Leonard St, Acushnet, MA 02743 and is currently estimated at $524,009, approximately $524 per square foot. 236 Leonard St is a home located in Bristol County with nearby schools including Acushnet Elementary School, Albert F Ford Middle School, and Alma del Mar Charter School.
Ownership History
Date
Name
Owned For
Owner Type
Purchase Details
Closed on
Jun 9, 2009
Sold by
Cote Michael J
Bought by
Cote Michael and Cote Suzanne A
Current Estimated Value
Home Financials for this Owner
Home Financials are based on the most recent Mortgage that was taken out on this home.
Original Mortgage
$84,000
Outstanding Balance
$53,244
Interest Rate
4.83%
Mortgage Type
Purchase Money Mortgage
Estimated Equity
$470,765
Purchase Details
Closed on
Dec 28, 1993
Sold by
Otocki Henry J and Otocki Maria
Bought by
Cote Michael
Create a Home Valuation Report for This Property
The Home Valuation Report is an in-depth analysis detailing your home's value as well as a comparison with similar homes in the area
Home Values in the Area
Average Home Value in this Area
Purchase History
| Date | Buyer | Sale Price | Title Company |
|---|---|---|---|
| Cote Michael | -- | -- | |
| Cote Michael | $35,000 | -- |
Source: Public Records
Mortgage History
| Date | Status | Borrower | Loan Amount |
|---|---|---|---|
| Open | Cote Michael | $84,000 | |
| Previous Owner | Cote Michael | $125,000 | |
| Previous Owner | Cote Michael | $50,000 |
Source: Public Records
Tax History
| Year | Tax Paid | Tax Assessment Tax Assessment Total Assessment is a certain percentage of the fair market value that is determined by local assessors to be the total taxable value of land and additions on the property. | Land | Improvement |
|---|---|---|---|---|
| 2025 | $45 | $418,300 | $141,100 | $277,200 |
| 2024 | $4,361 | $382,200 | $133,700 | $248,500 |
| 2023 | $4,236 | $353,000 | $121,300 | $231,700 |
| 2022 | $4,237 | $319,300 | $113,900 | $205,400 |
| 2021 | $4,092 | $295,900 | $113,900 | $182,000 |
| 2020 | $4,020 | $288,400 | $106,400 | $182,000 |
| 2019 | $3,905 | $275,400 | $101,500 | $173,900 |
| 2018 | $3,738 | $259,200 | $101,500 | $157,700 |
| 2017 | $3,613 | $250,200 | $101,500 | $148,700 |
| 2016 | $3,554 | $244,600 | $101,500 | $143,100 |
| 2015 | $3,379 | $236,600 | $101,500 | $135,100 |
Source: Public Records
Map
Nearby Homes
- 0 Land Way Unit 73479153
- 0 Keene Rd Unit 73459818
- 1 Rounseville Rd
- 489 Main St
- 168 Keene Rd
- 199 Quaker Ln
- 363 Main St
- 329 Middle Rd
- 134 Nyes Ln
- SS Charbonneau Ln
- 898 Tobey St
- 25 Pershing Ave
- 1015 Forbes St
- 41 Chershire Ave
- 7 Hamlin St
- 23 Oliveira Ave
- 40 Foley Dr
- 34 Poplar Rd
- ES Acushnet Ave
- 23 Coury Dr
Your Personal Tour Guide
Ask me questions while you tour the home.