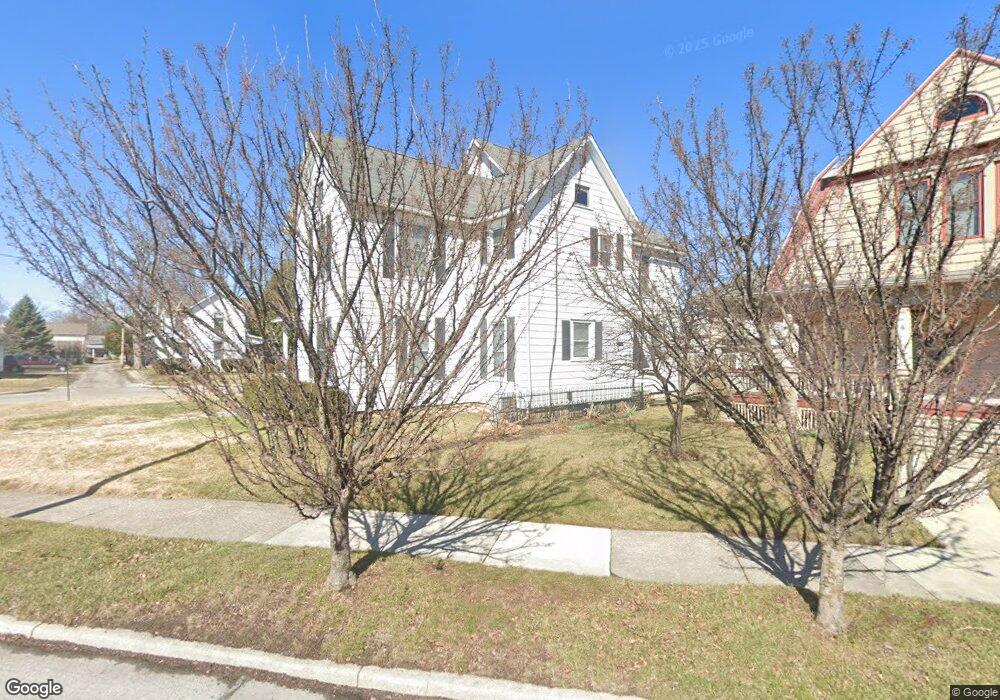
236 Lima Ave Findlay, OH 45840
Estimated Value: $176,000 - $224,000
4
Beds
2
Baths
2,592
Sq Ft
$76/Sq Ft
Est. Value
About This Home
This home is located at 236 Lima Ave, Findlay, OH 45840 and is currently estimated at $197,833, approximately $76 per square foot. 236 Lima Ave is a home located in Hancock County with nearby schools including Lincoln Elementary School, Donnell Middle School, and Findlay High School.
Ownership History
Date
Name
Owned For
Owner Type
Purchase Details
Closed on
Sep 27, 2024
Sold by
Schiltz Brandon Michael and Schiltz Jennifer Kay
Bought by
Bmjk Property Management Llc
Current Estimated Value
Purchase Details
Closed on
Mar 31, 2022
Sold by
Morehart Jerry D and Morehart Tamera M
Bought by
Schiltz Jennifer Kay and Schiltz Brandon
Home Financials for this Owner
Home Financials are based on the most recent Mortgage that was taken out on this home.
Original Mortgage
$108,750
Interest Rate
4.67%
Mortgage Type
New Conventional
Purchase Details
Closed on
Oct 1, 2004
Sold by
Rule Carlton L and Rule Ruthanna
Bought by
Morehart Jerry D and Morehart Tamera M
Home Financials for this Owner
Home Financials are based on the most recent Mortgage that was taken out on this home.
Original Mortgage
$85,500
Interest Rate
5%
Mortgage Type
Purchase Money Mortgage
Create a Home Valuation Report for This Property
The Home Valuation Report is an in-depth analysis detailing your home's value as well as a comparison with similar homes in the area
Home Values in the Area
Average Home Value in this Area
Purchase History
| Date | Buyer | Sale Price | Title Company |
|---|---|---|---|
| Bmjk Property Management Llc | -- | None Listed On Document | |
| Schiltz Jennifer Kay | -- | None Listed On Document | |
| Morehart Jerry D | $107,000 | Assured Title Agency |
Source: Public Records
Mortgage History
| Date | Status | Borrower | Loan Amount |
|---|---|---|---|
| Previous Owner | Schiltz Jennifer Kay | $108,750 | |
| Previous Owner | Morehart Jerry D | $85,500 | |
| Closed | Morehart Jerry D | $21,000 |
Source: Public Records
Tax History Compared to Growth
Tax History
| Year | Tax Paid | Tax Assessment Tax Assessment Total Assessment is a certain percentage of the fair market value that is determined by local assessors to be the total taxable value of land and additions on the property. | Land | Improvement |
|---|---|---|---|---|
| 2024 | $1,812 | $49,700 | $4,430 | $45,270 |
| 2023 | $1,815 | $49,700 | $4,430 | $45,270 |
| 2022 | $1,808 | $49,700 | $4,430 | $45,270 |
| 2021 | $1,371 | $32,820 | $4,550 | $28,270 |
| 2020 | $1,371 | $32,820 | $4,550 | $28,270 |
| 2019 | $1,344 | $32,820 | $4,550 | $28,270 |
| 2018 | $1,179 | $26,420 | $3,640 | $22,780 |
| 2017 | $590 | $26,420 | $3,640 | $22,780 |
| 2016 | $1,173 | $26,420 | $3,640 | $22,780 |
| 2015 | $1,427 | $31,730 | $4,060 | $27,670 |
| 2014 | $1,427 | $31,730 | $4,060 | $27,670 |
| 2012 | $1,905 | $42,070 | $4,060 | $38,010 |
Source: Public Records
Map
Nearby Homes
- 905 S West St
- 225 Lima Ave
- 720 S West St
- 412 Lima Ave
- 419 W Lincoln St
- 416 1/2 Lima Ave
- 527 W Lincoln St
- 1115 Liberty St
- 514 Liberty St
- 202 Hancock St
- 829 Maple Ave
- 801 W Sandusky St
- 420 1st St
- 123 Glendale Ave
- 817 Park St
- 1421 Hurd Ave
- 407 Washington St
- 1109 Park St
- 210 Western Ave
- 915 W Main Cross St