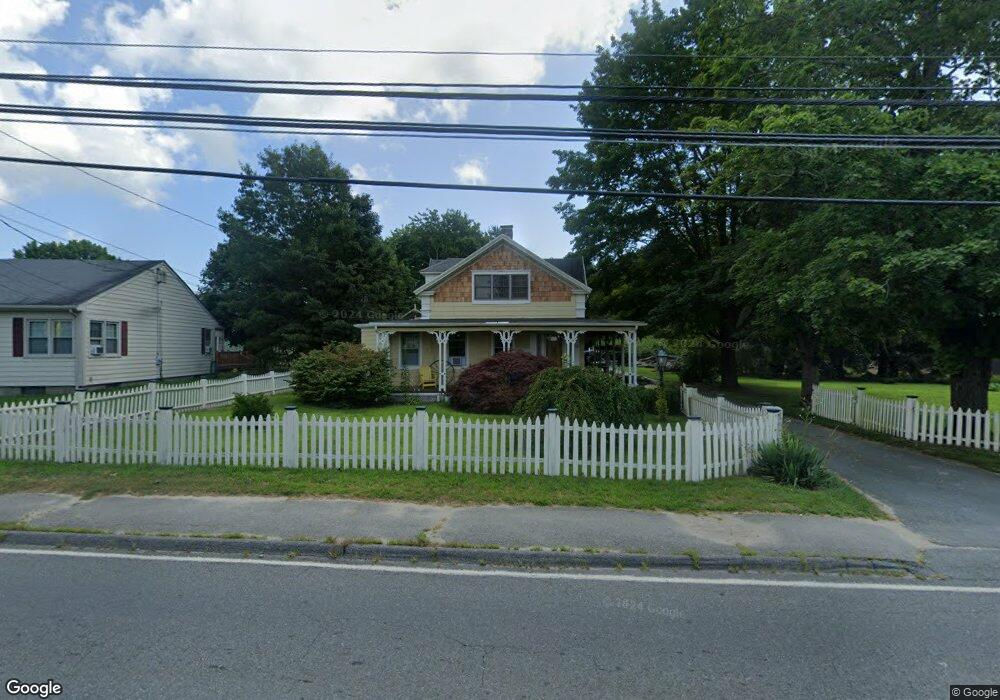
236 Main St Acushnet, MA 02743
Upper Acushnet NeighborhoodEstimated Value: $522,000 - $653,585
4
Beds
2
Baths
2,987
Sq Ft
$197/Sq Ft
Est. Value
About This Home
This home is located at 236 Main St, Acushnet, MA 02743 and is currently estimated at $589,146, approximately $197 per square foot. 236 Main St is a home located in Bristol County with nearby schools including Acushnet Elementary School, Albert F Ford Middle School, and Alma Del Mar Charter School.
Ownership History
Date
Name
Owned For
Owner Type
Purchase Details
Closed on
Dec 21, 2020
Sold by
Langlois T
Bought by
Langlois 2020 T
Current Estimated Value
Purchase Details
Closed on
Mar 7, 2008
Sold by
Langlois Lillian M and Langlois Paul A
Bought by
Langlois T and Langlois Lillian M
Purchase Details
Closed on
Nov 2, 2007
Sold by
Sleight Ft and Sleight Diane C
Bought by
Langlois Lillian M and Langlois Paul A
Home Financials for this Owner
Home Financials are based on the most recent Mortgage that was taken out on this home.
Original Mortgage
$220,000
Interest Rate
6.43%
Mortgage Type
Purchase Money Mortgage
Create a Home Valuation Report for This Property
The Home Valuation Report is an in-depth analysis detailing your home's value as well as a comparison with similar homes in the area
Home Values in the Area
Average Home Value in this Area
Purchase History
| Date | Buyer | Sale Price | Title Company |
|---|---|---|---|
| Langlois 2020 T | -- | None Available | |
| Langlois T | -- | -- | |
| Langlois Lillian M | $450,000 | -- |
Source: Public Records
Mortgage History
| Date | Status | Borrower | Loan Amount |
|---|---|---|---|
| Previous Owner | Langlois Lillian M | $220,000 |
Source: Public Records
Tax History
| Year | Tax Paid | Tax Assessment Tax Assessment Total Assessment is a certain percentage of the fair market value that is determined by local assessors to be the total taxable value of land and additions on the property. | Land | Improvement |
|---|---|---|---|---|
| 2025 | $67 | $618,000 | $173,400 | $444,600 |
| 2024 | $6,252 | $547,900 | $164,300 | $383,600 |
| 2023 | $6,166 | $513,800 | $149,100 | $364,700 |
| 2022 | $6,136 | $462,400 | $140,100 | $322,300 |
| 2021 | $6,121 | $426,400 | $140,100 | $286,300 |
| 2020 | $6,041 | $417,400 | $131,100 | $286,300 |
| 2019 | $5,285 | $372,700 | $125,100 | $247,600 |
| 2018 | $0 | $372,700 | $125,100 | $247,600 |
| 2017 | $5,223 | $361,700 | $125,100 | $236,600 |
| 2016 | $5,070 | $348,900 | $125,100 | $223,800 |
| 2015 | $4,982 | $348,900 | $125,100 | $223,800 |
Source: Public Records
Map
Nearby Homes
Your Personal Tour Guide
Ask me questions while you tour the home.