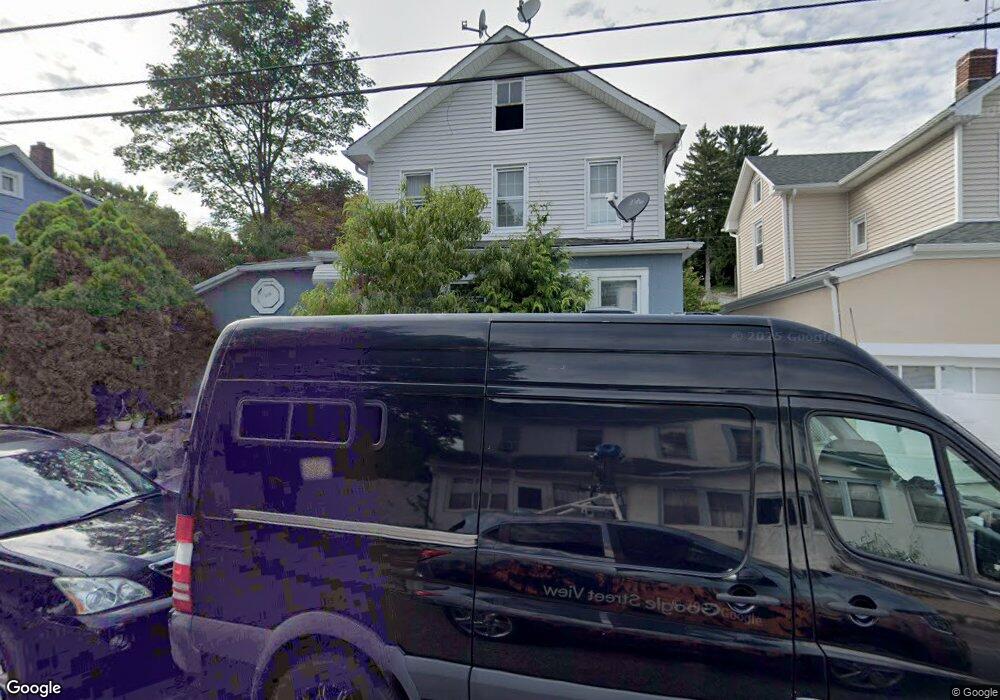
236 Mechanic St Boonton, NJ 07005
Estimated Value: $550,000 - $598,000
--
Bed
--
Bath
2,089
Sq Ft
$270/Sq Ft
Est. Value
About This Home
This home is located at 236 Mechanic St, Boonton, NJ 07005 and is currently estimated at $563,623, approximately $269 per square foot. 236 Mechanic St is a home located in Morris County with nearby schools including School Street Elementary School, John Hill Elementary School, and Boonton High School.
Ownership History
Date
Name
Owned For
Owner Type
Purchase Details
Closed on
Feb 1, 2000
Sold by
Brishcar John and Brishcar Elizabeth
Bought by
Lliguicota Julio
Current Estimated Value
Home Financials for this Owner
Home Financials are based on the most recent Mortgage that was taken out on this home.
Original Mortgage
$159,818
Interest Rate
8.11%
Mortgage Type
FHA
Create a Home Valuation Report for This Property
The Home Valuation Report is an in-depth analysis detailing your home's value as well as a comparison with similar homes in the area
Home Values in the Area
Average Home Value in this Area
Purchase History
| Date | Buyer | Sale Price | Title Company |
|---|---|---|---|
| Lliguicota Julio | $159,900 | Stonebridge Title Services I |
Source: Public Records
Mortgage History
| Date | Status | Borrower | Loan Amount |
|---|---|---|---|
| Open | Lliguicota Julio | $159,818 |
Source: Public Records
Tax History Compared to Growth
Tax History
| Year | Tax Paid | Tax Assessment Tax Assessment Total Assessment is a certain percentage of the fair market value that is determined by local assessors to be the total taxable value of land and additions on the property. | Land | Improvement |
|---|---|---|---|---|
| 2025 | $10,373 | $306,900 | $134,000 | $172,900 |
| 2024 | $10,100 | $306,900 | $134,000 | $172,900 |
| 2023 | $10,100 | $306,900 | $134,000 | $172,900 |
| 2022 | $9,572 | $306,900 | $134,000 | $172,900 |
| 2021 | $9,572 | $306,900 | $134,000 | $172,900 |
| 2020 | $9,176 | $306,900 | $134,000 | $172,900 |
| 2019 | $9,296 | $306,900 | $134,000 | $172,900 |
| 2018 | $9,050 | $306,900 | $134,000 | $172,900 |
| 2017 | $8,673 | $306,900 | $134,000 | $172,900 |
| 2016 | $8,446 | $306,900 | $134,000 | $172,900 |
| 2015 | $8,308 | $306,900 | $134,000 | $172,900 |
| 2014 | $8,124 | $306,900 | $134,000 | $172,900 |
Source: Public Records
Map
Nearby Homes
- 209 William St
- 315 William St
- 314 Cornelia St Unit 4
- 411 William St
- 609 Birch St
- 331 Church St
- 205 Myrtle Ave
- 120 Birch St
- 168 Kanouse St
- 919 Cedar St
- 414 Green St
- 150 Kanouse St
- 141 Roessler St
- 719 Hillside Ave
- 712 Wootton St
- 646 Cornelia St
- 327 Lincoln St
- 118 Addison St
- 725 Cornelia St
- 330 Lincoln St