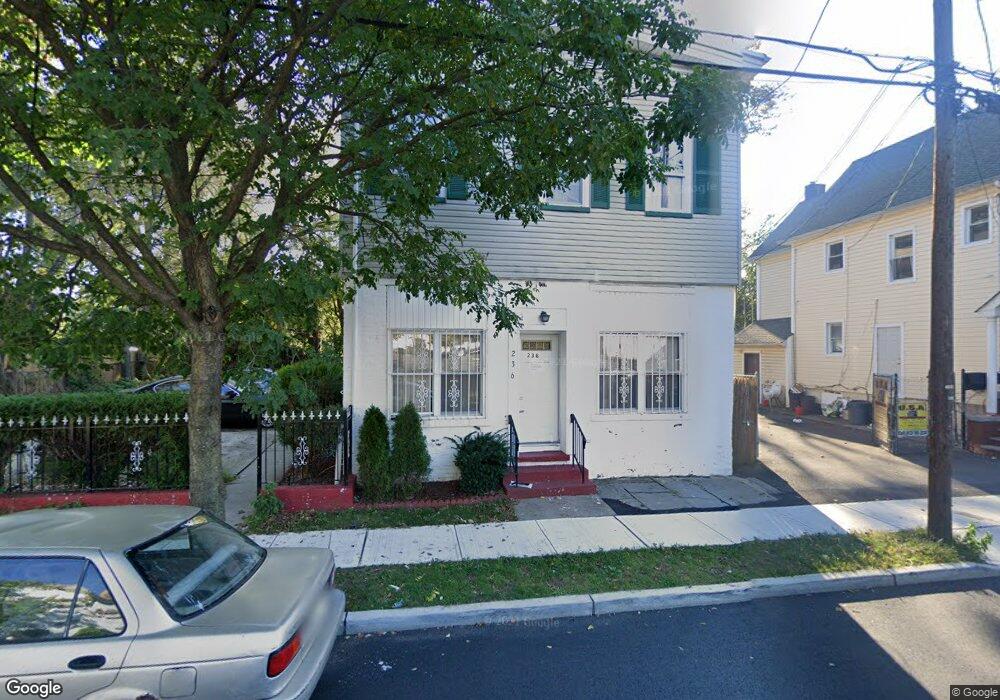
236 New St Orange, NJ 07050
Estimated Value: $329,000 - $444,000
Studio
--
Bath
1,440
Sq Ft
$255/Sq Ft
Est. Value
About This Home
This home is located at 236 New St, Orange, NJ 07050 and is currently estimated at $367,027, approximately $254 per square foot. 236 New St is a home located in Essex County with nearby schools including East Orange Community Charter School.
Ownership History
Date
Name
Owned For
Owner Type
Purchase Details
Closed on
Apr 6, 2015
Sold by
Stewart Christine
Bought by
Stewart Christine
Current Estimated Value
Purchase Details
Closed on
Apr 23, 1997
Sold by
Housing & Neighborhood Devt
Bought by
Stewart Ovetta
Home Financials for this Owner
Home Financials are based on the most recent Mortgage that was taken out on this home.
Original Mortgage
$63,000
Interest Rate
7.85%
Purchase Details
Closed on
Jun 13, 1996
Sold by
Faith Temple Free Witt
Bought by
Housing & Neighborhood Devel
Create a Home Valuation Report for This Property
The Home Valuation Report is an in-depth analysis detailing your home's value as well as a comparison with similar homes in the area
Home Values in the Area
Average Home Value in this Area
Purchase History
| Date | Buyer | Sale Price | Title Company |
|---|---|---|---|
| Stewart Christine | -- | -- | |
| Stewart Ovetta | $62,500 | -- | |
| Housing & Neighborhood Devel | $20,000 | -- |
Source: Public Records
Mortgage History
| Date | Status | Borrower | Loan Amount |
|---|---|---|---|
| Previous Owner | Stewart Ovetta | $63,000 |
Source: Public Records
Tax History
| Year | Tax Paid | Tax Assessment Tax Assessment Total Assessment is a certain percentage of the fair market value that is determined by local assessors to be the total taxable value of land and additions on the property. | Land | Improvement |
|---|---|---|---|---|
| 2025 | $4,640 | $124,500 | $101,900 | $22,600 |
| 2024 | $4,640 | $124,500 | $101,900 | $22,600 |
| 2022 | $4,315 | $124,500 | $101,900 | $22,600 |
| 2021 | $4,237 | $73,300 | $39,700 | $33,600 |
| 2020 | $4,110 | $73,300 | $39,700 | $33,600 |
| 2019 | $3,896 | $73,300 | $39,700 | $33,600 |
| 2018 | $3,834 | $73,300 | $39,700 | $33,600 |
| 2017 | $3,570 | $73,300 | $39,700 | $33,600 |
| 2016 | $3,502 | $73,300 | $39,700 | $33,600 |
| 2015 | $3,411 | $73,300 | $39,700 | $33,600 |
| 2014 | $3,261 | $73,300 | $39,700 | $33,600 |
Source: Public Records
Map
Nearby Homes
Your Personal Tour Guide
Ask me questions while you tour the home.