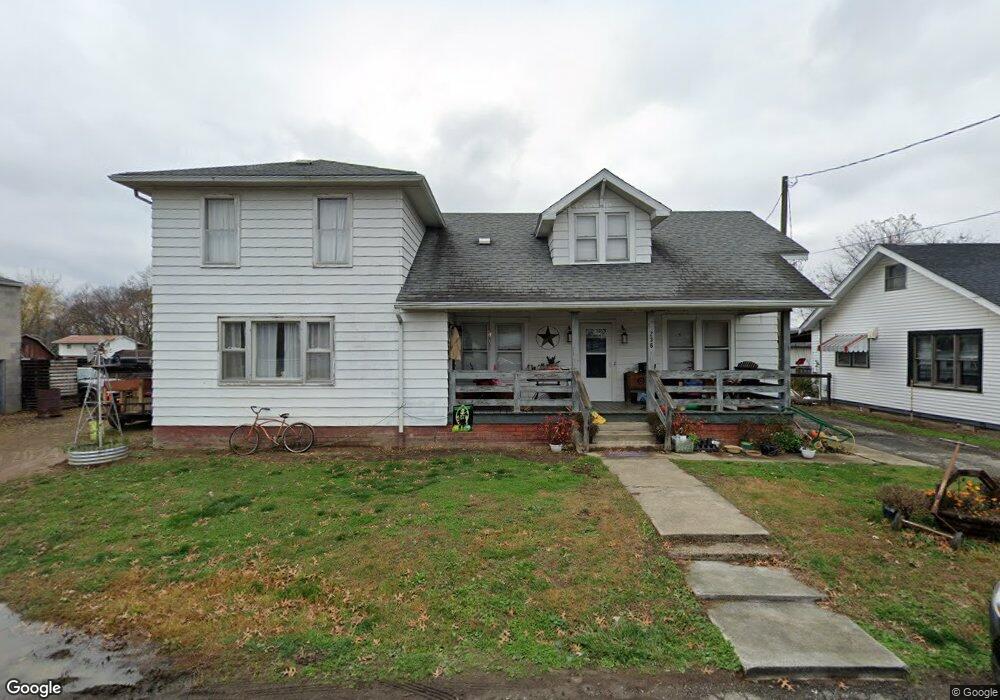
236 Ridge St South Shore, KY 41175
Estimated Value: $66,000 - $140,586
5
Beds
2
Baths
2,000
Sq Ft
$56/Sq Ft
Est. Value
About This Home
This home is located at 236 Ridge St, South Shore, KY 41175 and is currently estimated at $111,647, approximately $55 per square foot. 236 Ridge St is a home located in Greenup County with nearby schools including Greenup County High School, Notre Dame Elementary School, and Portsmouth Stem Academy.
Ownership History
Date
Name
Owned For
Owner Type
Purchase Details
Closed on
Sep 7, 2012
Sold by
Home Telos Lp
Bought by
Tavis Donna
Current Estimated Value
Purchase Details
Closed on
Apr 28, 2006
Sold by
Blackburn Thomas L and Blackburn Thomas L
Bought by
Griffith Glen A and Griffith Hazel
Home Financials for this Owner
Home Financials are based on the most recent Mortgage that was taken out on this home.
Original Mortgage
$15,980
Interest Rate
6.33%
Create a Home Valuation Report for This Property
The Home Valuation Report is an in-depth analysis detailing your home's value as well as a comparison with similar homes in the area
Home Values in the Area
Average Home Value in this Area
Purchase History
| Date | Buyer | Sale Price | Title Company |
|---|---|---|---|
| Tavis Donna | $35,600 | -- | |
| Griffith Glen A | $79,900 | -- |
Source: Public Records
Mortgage History
| Date | Status | Borrower | Loan Amount |
|---|---|---|---|
| Previous Owner | Griffith Glen A | $15,980 | |
| Previous Owner | Griffith Glen A | $63,920 |
Source: Public Records
Tax History Compared to Growth
Tax History
| Year | Tax Paid | Tax Assessment Tax Assessment Total Assessment is a certain percentage of the fair market value that is determined by local assessors to be the total taxable value of land and additions on the property. | Land | Improvement |
|---|---|---|---|---|
| 2025 | $1,629 | $82,500 | $15,000 | $67,500 |
| 2024 | $1,620 | $82,500 | $15,000 | $67,500 |
| 2023 | $1,538 | $82,500 | $15,000 | $67,500 |
| 2022 | $1,503 | $82,500 | $15,000 | $67,500 |
| 2021 | $0 | $82,500 | $15,000 | $67,500 |
| 2020 | $993 | $56,600 | $15,000 | $41,600 |
| 2019 | $1,033 | $56,600 | $15,000 | $41,600 |
| 2018 | $1,057 | $56,600 | $15,000 | $41,600 |
| 2017 | $1,012 | $56,600 | $15,000 | $41,600 |
| 2016 | $1,012 | $56,600 | $15,000 | $41,600 |
| 2015 | $1,001 | $56,600 | $15,000 | $41,600 |
| 2014 | $986 | $56,600 | $15,000 | $41,600 |
| 2011 | -- | $61,700 | $15,000 | $46,700 |
Source: Public Records
Map
Nearby Homes