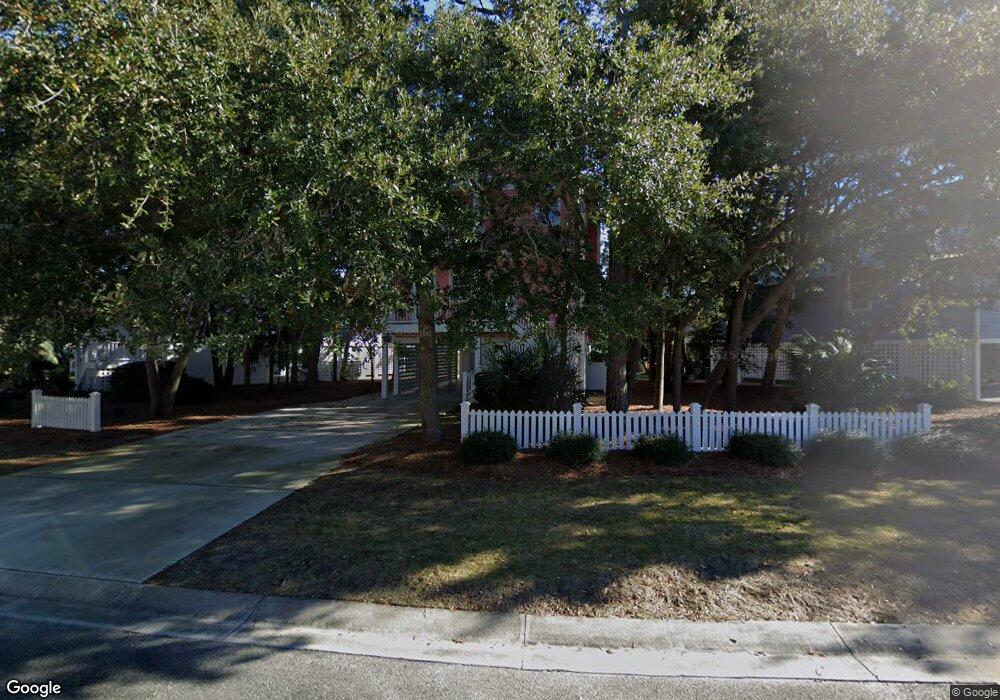
236 Seawatch Way Kure Beach, NC 28449
Estimated Value: $980,715 - $1,279,000
4
Beds
4
Baths
2,363
Sq Ft
$480/Sq Ft
Est. Value
About This Home
This home is located at 236 Seawatch Way, Kure Beach, NC 28449 and is currently estimated at $1,133,179, approximately $479 per square foot. 236 Seawatch Way is a home located in New Hanover County with nearby schools including Carolina Beach Elementary School, Charles P. Murray Middle School, and Eugene Ashley High School.
Ownership History
Date
Name
Owned For
Owner Type
Purchase Details
Closed on
Jun 29, 2010
Sold by
Shumaker Susan F and Shumaker Bradley
Bought by
Shumaker Susan F and Shumaker Bradley
Current Estimated Value
Home Financials for this Owner
Home Financials are based on the most recent Mortgage that was taken out on this home.
Original Mortgage
$409,000
Outstanding Balance
$273,276
Interest Rate
4.83%
Mortgage Type
New Conventional
Estimated Equity
$859,903
Purchase Details
Closed on
Mar 2, 2005
Sold by
Lorenz Rene and Lorenz Mary K
Bought by
Fitzgibbon Susan H
Home Financials for this Owner
Home Financials are based on the most recent Mortgage that was taken out on this home.
Original Mortgage
$79,000
Interest Rate
5.6%
Mortgage Type
Unknown
Purchase Details
Closed on
Oct 8, 2001
Sold by
Sea Watch Llc
Bought by
Lorenz Rene Mary K
Purchase Details
Closed on
Jul 8, 1999
Sold by
Inco United States Inc
Bought by
Sea Watch Llc
Create a Home Valuation Report for This Property
The Home Valuation Report is an in-depth analysis detailing your home's value as well as a comparison with similar homes in the area
Home Values in the Area
Average Home Value in this Area
Purchase History
| Date | Buyer | Sale Price | Title Company |
|---|---|---|---|
| Shumaker Susan F | -- | None Available | |
| Fitzgibbon Susan H | $865,000 | None Available | |
| Lorenz Rene Mary K | $81,500 | -- | |
| Sea Watch Llc | $4,300,000 | -- |
Source: Public Records
Mortgage History
| Date | Status | Borrower | Loan Amount |
|---|---|---|---|
| Open | Shumaker Susan F | $409,000 | |
| Closed | Fitzgibbon Susan H | $79,000 | |
| Closed | Fitzgibbon Susan H | $632,000 |
Source: Public Records
Tax History Compared to Growth
Tax History
| Year | Tax Paid | Tax Assessment Tax Assessment Total Assessment is a certain percentage of the fair market value that is determined by local assessors to be the total taxable value of land and additions on the property. | Land | Improvement |
|---|---|---|---|---|
| 2023 | $4,689 | $633,700 | $242,100 | $391,600 |
| 2022 | $4,568 | $633,700 | $242,100 | $391,600 |
| 2021 | $4,694 | $633,700 | $242,100 | $391,600 |
| 2020 | $4,351 | $486,200 | $153,200 | $333,000 |
| 2019 | $4,351 | $486,200 | $153,200 | $333,000 |
| 2018 | $4,303 | $486,200 | $153,200 | $333,000 |
| 2017 | $4,157 | $486,200 | $153,200 | $333,000 |
| 2016 | $3,799 | $418,400 | $177,700 | $240,700 |
| 2015 | $3,496 | $418,400 | $177,700 | $240,700 |
| 2014 | $3,412 | $418,400 | $177,700 | $240,700 |
Source: Public Records
Map
Nearby Homes
- 221 Seawatch Way Unit LT5050
- 601 Sloop Pointe Ln
- 805 Kure Village Way
- 605 Fort Fisher Blvd N Unit A
- 734 Sloop Pointe Ln
- 438 Sandman Dr
- 130 Heather Ln
- 129 Clementree Ln
- 410 N Fort Fisher Blvd
- 737 S Fort Fisher Blvd
- 761 Sailor Ct
- 114 Leeward Ct
- 337 N Fort Fisher Blvd
- 745 Settlers Ln
- 813 Cutter Ct
- 317 N Fort Fisher Blvd
- 822 Cutter Ct
- 313 N Fort Fisher Blvd Unit A
- 817 N Fort Fisher Blvd
- 310 Fort Fisher Blvd N
- 232 Seawatch Way
- 228 Seawatch Way
- 262 Seawatch Way
- 249 Seawatch Way
- 253 Seawatch Way
- 224 Seawatch Way
- 257 Seawatch Way
- 266 Seawatch Way
- 237 Seawatch Way
- 233 Seawatch Way
- 220 Seawatch Way
- 261 Seawatch Way
- 270 Seawatch Way
- 270 Seawatch Way
- 229 Seawatch Way
- 521 Kure Village Way
- 265 Seawatch Way
- 225 Seawatch Way Unit LT5151
- 216 Seawatch Way
- 642 Sloop Pointe Ln