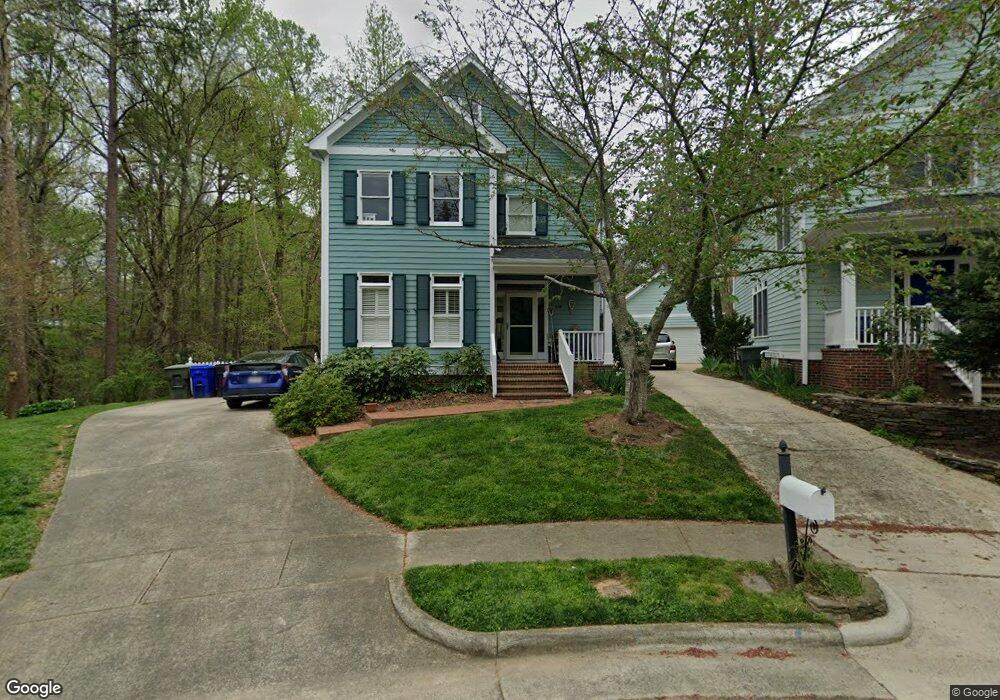
236 Stable Rd Carrboro, NC 27510
Estimated Value: $726,568 - $799,000
3
Beds
3
Baths
1,993
Sq Ft
$381/Sq Ft
Est. Value
About This Home
This home is located at 236 Stable Rd, Carrboro, NC 27510 and is currently estimated at $758,642, approximately $380 per square foot. 236 Stable Rd is a home located in Orange County with nearby schools including Smith Middle School, Chapel Hill High School, and St. Thomas More Catholic School.
Ownership History
Date
Name
Owned For
Owner Type
Purchase Details
Closed on
Jan 14, 2009
Sold by
Frey Ann M
Bought by
Smith Selden Kennedy and Smith Ann Frey
Current Estimated Value
Home Financials for this Owner
Home Financials are based on the most recent Mortgage that was taken out on this home.
Original Mortgage
$240,000
Outstanding Balance
$151,069
Interest Rate
5.43%
Mortgage Type
New Conventional
Estimated Equity
$607,573
Purchase Details
Closed on
Apr 30, 2003
Sold by
Holloway William J and Holloway Margaret Ward
Bought by
Frey Ann M
Home Financials for this Owner
Home Financials are based on the most recent Mortgage that was taken out on this home.
Original Mortgage
$228,000
Interest Rate
5.79%
Mortgage Type
Purchase Money Mortgage
Purchase Details
Closed on
Oct 31, 2001
Sold by
Capkov Ventures Inc
Bought by
Holloway William J and Holloway Margaret Ward
Home Financials for this Owner
Home Financials are based on the most recent Mortgage that was taken out on this home.
Original Mortgage
$255,100
Interest Rate
6.74%
Create a Home Valuation Report for This Property
The Home Valuation Report is an in-depth analysis detailing your home's value as well as a comparison with similar homes in the area
Home Values in the Area
Average Home Value in this Area
Purchase History
| Date | Buyer | Sale Price | Title Company |
|---|---|---|---|
| Smith Selden Kennedy | -- | Bb&T | |
| Frey Ann M | $285,000 | -- | |
| Holloway William J | $269,000 | -- |
Source: Public Records
Mortgage History
| Date | Status | Borrower | Loan Amount |
|---|---|---|---|
| Open | Smith Selden Kennedy | $240,000 | |
| Closed | Smith Selden Kennedy | $50,000 | |
| Closed | Frey Ann M | $228,000 | |
| Closed | Frey Ann M | $30,000 | |
| Previous Owner | Holloway William J | $255,100 |
Source: Public Records
Tax History
| Year | Tax Paid | Tax Assessment Tax Assessment Total Assessment is a certain percentage of the fair market value that is determined by local assessors to be the total taxable value of land and additions on the property. | Land | Improvement |
|---|---|---|---|---|
| 2025 | $10,569 | $764,400 | $400,000 | $364,400 |
| 2024 | $7,392 | $429,600 | $150,000 | $279,600 |
| 2023 | $7,268 | $429,600 | $150,000 | $279,600 |
| 2022 | $7,186 | $429,600 | $150,000 | $279,600 |
| 2021 | $7,132 | $429,600 | $150,000 | $279,600 |
| 2020 | $7,034 | $407,500 | $150,000 | $257,500 |
| 2018 | $6,917 | $407,500 | $150,000 | $257,500 |
| 2017 | $7,069 | $407,500 | $150,000 | $257,500 |
| 2016 | $7,069 | $415,447 | $112,762 | $302,685 |
| 2015 | $7,069 | $415,447 | $112,762 | $302,685 |
| 2014 | $7,029 | $415,447 | $112,762 | $302,685 |
Source: Public Records
Map
Nearby Homes
- 213 Stable Rd
- 306 Robert Hunt Dr
- 101 Thomas Ln Unit 3
- 201 Wild Oak Ln
- 107A Spring Valley Rd
- 102 Sue Ann Ct Unit A And B
- 101 Wild Oak Ln
- 201 Estes Dr Unit D
- 1530 Pathway Dr
- 2102 Pathway Dr
- 216 Ridge Trail
- 1100 W Main St
- 506 N Greensboro St Unit 35
- 1005 W Main St
- 101 Hanover Place
- 2214 Pathway Dr
- 105 Mary St
- 300 W Poplar Ave
- 100 Raven Ln
- 216 James St
- 236 Stable Point Rd
- 234 Stable Rd
- 238 Stable Rd
- 232 Stable Rd
- 240 Stable Rd
- 230 Stable Rd
- 245 Stable Rd
- 245 Stable Point Rd
- 230 Stable Point Rd
- 228 Stable Rd
- 243 Stable Rd
- 109 Hanna St
- 109 Hanna St Unit B
- 109 Hanna St Unit C
- 109 Hanna St Unit D
- 109 Hanna St Unit A
- 109 Hanna St Unit A,B,C,D
- 111 Hanna St
- 237 Stable Rd
- 241 Stable Rd
Your Personal Tour Guide
Ask me questions while you tour the home.