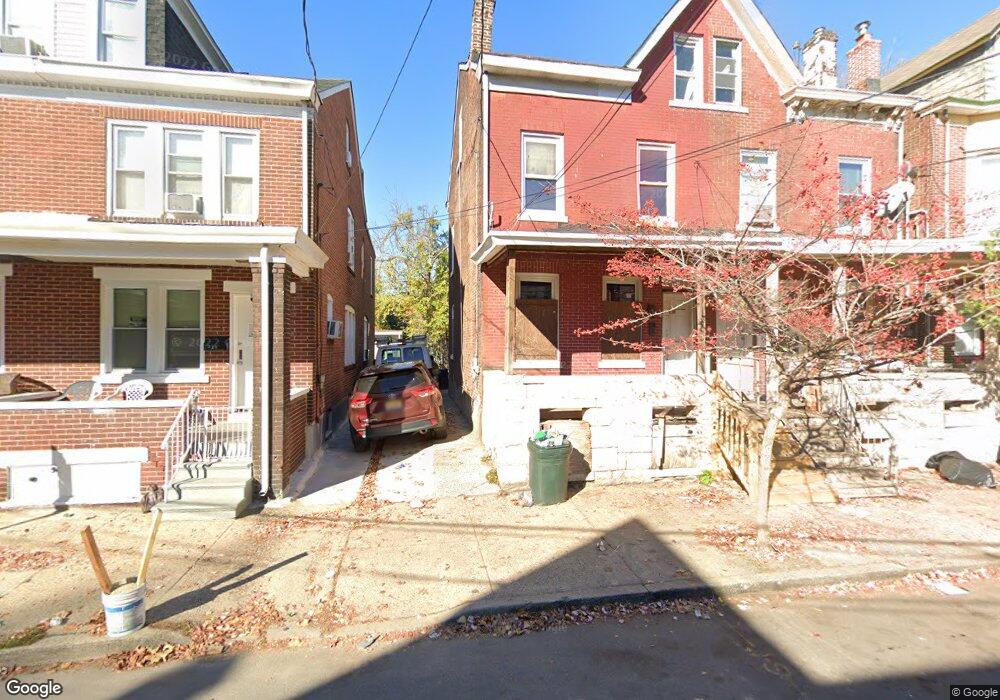
236 Tyler St Trenton, NJ 08609
Greenwood & Hamilton NeighborhoodEstimated Value: $182,000 - $259,000
3
Beds
3
Baths
1,408
Sq Ft
$155/Sq Ft
Est. Value
About This Home
This home is located at 236 Tyler St, Trenton, NJ 08609 and is currently estimated at $218,667, approximately $155 per square foot. 236 Tyler St is a home located in Mercer County with nearby schools including Robbins Elementary School, Monument Elementary School, and Dr. Martin Luther King Middle School.
Ownership History
Date
Name
Owned For
Owner Type
Purchase Details
Closed on
Mar 11, 2021
Sold by
Gsd Partners Llc
Bought by
Peace Holding Llc
Current Estimated Value
Purchase Details
Closed on
Mar 10, 2021
Sold by
Vanegas Christian A and Mercado Mayol Dannitza
Bought by
Gsd Partners Llc
Purchase Details
Closed on
Apr 7, 2006
Sold by
Hud
Bought by
Bangiyev Boris
Create a Home Valuation Report for This Property
The Home Valuation Report is an in-depth analysis detailing your home's value as well as a comparison with similar homes in the area
Home Values in the Area
Average Home Value in this Area
Purchase History
| Date | Buyer | Sale Price | Title Company |
|---|---|---|---|
| Peace Holding Llc | $85,000 | Sjs Title Llc | |
| Gsd Partners Llc | $48,500 | Sjs Title Llc | |
| Bangiyev Boris | $74,100 | -- |
Source: Public Records
Tax History Compared to Growth
Tax History
| Year | Tax Paid | Tax Assessment Tax Assessment Total Assessment is a certain percentage of the fair market value that is determined by local assessors to be the total taxable value of land and additions on the property. | Land | Improvement |
|---|---|---|---|---|
| 2025 | $3,162 | $54,500 | $16,500 | $38,000 |
| 2024 | $3,034 | $54,500 | $16,500 | $38,000 |
| 2023 | $3,034 | $54,500 | $16,500 | $38,000 |
| 2022 | $2,975 | $54,500 | $16,500 | $38,000 |
| 2021 | $3,026 | $54,500 | $16,500 | $38,000 |
| 2020 | $3,017 | $54,500 | $16,500 | $38,000 |
| 2019 | $2,968 | $54,500 | $16,500 | $38,000 |
| 2018 | $2,841 | $54,500 | $16,500 | $38,000 |
| 2017 | $2,700 | $54,500 | $16,500 | $38,000 |
| 2016 | $4,240 | $73,700 | $12,000 | $61,700 |
| 2015 | $4,225 | $73,700 | $12,000 | $61,700 |
| 2014 | $4,205 | $73,700 | $12,000 | $61,700 |
Source: Public Records
Map
Nearby Homes