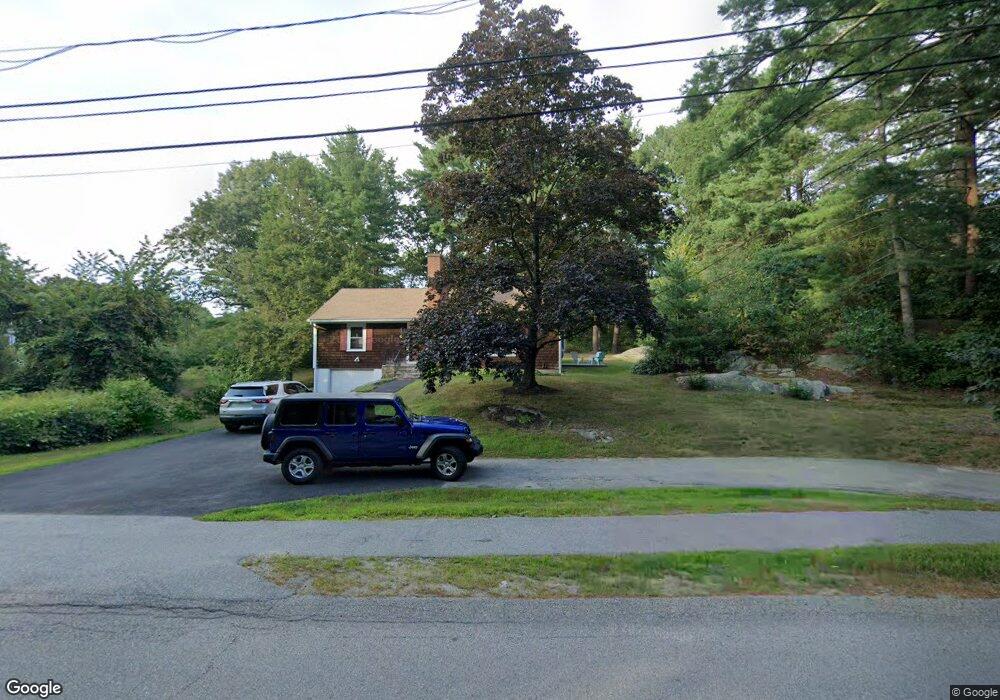
236 Ward St Hingham, MA 02043
Estimated Value: $1,513,000 - $2,060,000
4
Beds
4
Baths
2,644
Sq Ft
$629/Sq Ft
Est. Value
About This Home
This home is located at 236 Ward St, Hingham, MA 02043 and is currently estimated at $1,662,216, approximately $628 per square foot. 236 Ward St is a home located in Plymouth County with nearby schools including Plymouth River Elementary School, Hingham Middle School, and Hingham High School.
Ownership History
Date
Name
Owned For
Owner Type
Purchase Details
Closed on
Aug 6, 2020
Sold by
Cassidy Nicole M and Cassidy James M
Bought by
Cassidy Ft 2020 and Cassidy
Current Estimated Value
Purchase Details
Closed on
Sep 28, 2017
Sold by
Eeyor Rt and Trifone
Bought by
Trifone Nicole M and Cassidy James M
Home Financials for this Owner
Home Financials are based on the most recent Mortgage that was taken out on this home.
Original Mortgage
$324,000
Interest Rate
3.89%
Mortgage Type
New Conventional
Purchase Details
Closed on
Apr 11, 2007
Sold by
Clapp Robert W and Clapp Deborah L
Bought by
Eeyore Rt and Trifone
Home Financials for this Owner
Home Financials are based on the most recent Mortgage that was taken out on this home.
Original Mortgage
$221,000
Interest Rate
6.24%
Mortgage Type
Purchase Money Mortgage
Create a Home Valuation Report for This Property
The Home Valuation Report is an in-depth analysis detailing your home's value as well as a comparison with similar homes in the area
Purchase History
| Date | Buyer | Sale Price | Title Company |
|---|---|---|---|
| Cassidy Ft 2020 | -- | None Available | |
| Trifone Nicole M | $405,000 | -- | |
| Eeyore Rt | $295,000 | -- |
Source: Public Records
Mortgage History
| Date | Status | Borrower | Loan Amount |
|---|---|---|---|
| Previous Owner | Trifone Nicole M | $324,000 | |
| Previous Owner | Eeyore Rt | $221,000 | |
| Previous Owner | Eeyore Rt | $209,500 |
Source: Public Records
Tax History
| Year | Tax Paid | Tax Assessment Tax Assessment Total Assessment is a certain percentage of the fair market value that is determined by local assessors to be the total taxable value of land and additions on the property. | Land | Improvement |
|---|---|---|---|---|
| 2025 | $14,309 | $1,338,500 | $372,600 | $965,900 |
| 2024 | $12,683 | $1,168,900 | $372,600 | $796,300 |
| 2023 | $11,117 | $1,111,700 | $346,000 | $765,700 |
| 2022 | $12,462 | $1,078,000 | $301,500 | $776,500 |
| 2021 | $11,105 | $941,100 | $301,500 | $639,600 |
| 2020 | $5,179 | $449,200 | $301,500 | $147,700 |
| 2019 | $5,202 | $440,500 | $301,500 | $139,000 |
| 2018 | $4,978 | $422,900 | $301,500 | $121,400 |
| 2017 | $6,089 | $497,100 | $376,800 | $120,300 |
| 2016 | $5,984 | $479,100 | $358,800 | $120,300 |
| 2015 | $5,786 | $461,800 | $341,500 | $120,300 |
Source: Public Records
Map
Nearby Homes
- 2 Black Rock Dr Unit 21
- 2 Black Rock Dr
- 5 Old County Rd
- 1 Hemlock Rd
- 1 Kerri Ln
- 4 Kerri Ln
- 1276 Washington St Unit A
- 183 Gardner St
- 1297 Pleasant St
- 22 Longmeadow Rd
- 14 Old Stone Way Unit 11
- 18 Whiting Ln
- 14 Cross St
- 21 S Bradford Rd
- 32-70 Lazell St
- 6 Brewer Way
- 10 Colby Rd
- 126 Lakehurst Ave
- 70 Lazell St
- 100 Whiting St
Your Personal Tour Guide
Ask me questions while you tour the home.