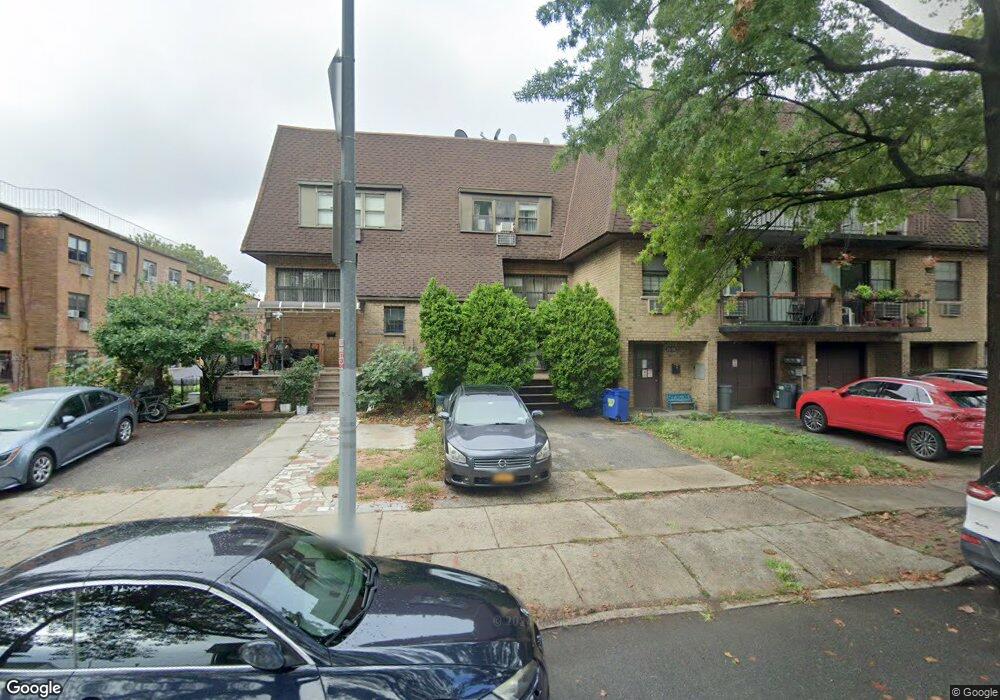
2360 79th St Unit 11 East Elmhurst, NY 11370
Jackson Heights NeighborhoodEstimated Value: $906,000 - $1,444,492
--
Bed
--
Bath
2,945
Sq Ft
$405/Sq Ft
Est. Value
About This Home
This home is located at 2360 79th St Unit 11, East Elmhurst, NY 11370 and is currently estimated at $1,192,497, approximately $404 per square foot. 2360 79th St Unit 11 is a home located in Queens County with nearby schools including P.S. 2 Alfred Zimberg, Is 141 The Steinway, and William Cullen Bryant High School.
Ownership History
Date
Name
Owned For
Owner Type
Purchase Details
Closed on
Jul 10, 2023
Sold by
Sanchez Irma N and Sanchez Jaime A
Bought by
Sanchez Sandra P
Current Estimated Value
Purchase Details
Closed on
Dec 1, 2000
Sold by
Vargas Franklin and Vargas Kathy
Bought by
Sanchez Irma Nury and Sanchez Sandra
Home Financials for this Owner
Home Financials are based on the most recent Mortgage that was taken out on this home.
Original Mortgage
$278,000
Interest Rate
7.52%
Mortgage Type
Purchase Money Mortgage
Purchase Details
Closed on
Jun 8, 1995
Sold by
Home Fsb
Bought by
Vargas Franklin E and Vargas Kathy
Home Financials for this Owner
Home Financials are based on the most recent Mortgage that was taken out on this home.
Original Mortgage
$183,000
Interest Rate
6.2%
Mortgage Type
Purchase Money Mortgage
Create a Home Valuation Report for This Property
The Home Valuation Report is an in-depth analysis detailing your home's value as well as a comparison with similar homes in the area
Home Values in the Area
Average Home Value in this Area
Purchase History
| Date | Buyer | Sale Price | Title Company |
|---|---|---|---|
| Sanchez Sandra P | $250,000 | -- | |
| Sanchez Irma Nury | $347,500 | Cb Title | |
| Vargas Franklin E | $215,000 | Chicago Title Insurance Co |
Source: Public Records
Mortgage History
| Date | Status | Borrower | Loan Amount |
|---|---|---|---|
| Previous Owner | Sanchez Irma Nury | $278,000 | |
| Previous Owner | Vargas Franklin E | $183,000 |
Source: Public Records
Tax History Compared to Growth
Tax History
| Year | Tax Paid | Tax Assessment Tax Assessment Total Assessment is a certain percentage of the fair market value that is determined by local assessors to be the total taxable value of land and additions on the property. | Land | Improvement |
|---|---|---|---|---|
| 2025 | $7,091 | $35,575 | $2,363 | $33,212 |
| 2024 | $7,091 | $35,306 | $2,559 | $32,747 |
| 2023 | $6,409 | $33,309 | $2,652 | $30,657 |
| 2022 | $5,670 | $51,123 | $4,623 | $46,500 |
| 2021 | $5,943 | $51,123 | $4,623 | $46,500 |
| 2020 | $5,979 | $49,326 | $4,623 | $44,703 |
| 2019 | $5,862 | $51,890 | $4,623 | $47,267 |
| 2018 | $5,361 | $27,758 | $2,592 | $25,166 |
| 2017 | $5,039 | $26,187 | $2,496 | $23,691 |
| 2016 | $4,629 | $26,187 | $2,496 | $23,691 |
| 2015 | $2,760 | $24,705 | $3,202 | $21,503 |
| 2014 | $2,760 | $24,519 | $3,466 | $21,053 |
Source: Public Records
Map
Nearby Homes
- 23-63 79th St
- 22-60 79th St Unit 1A
- 2255 78th St Unit 2E
- 24-23 83rd St
- 22-40 80th St Unit 2B
- 24 W 83rd St Unit 1F
- 25-31 81st St
- 22-39 78 St
- 22-31 77th St Unit C2
- 25-10 76th St
- 25-27 76th St
- 2220 78th St Unit A3
- 25-44 82nd St
- 22-30 76th St Unit C2
- 22-27 76 St Unit B2
- 2209 76th St Unit C2
- 2541 83rd St
- 30-05 81st St
- 76-12 Ditmars Blvd Unit B3
- 24-41 85th St
- 2362 79th St Unit 10
- 23-54 79th St
- 2358 79th St
- 23-60 79 St
- 23-62 79th St
- 2356 79th St
- 7815 24th Ave
- 7817 24th Ave Unit 2
- 2354 79th St
- 7811 24th Ave Unit 4
- 78-19 24th Ave Unit 3
- 7819 24th Ave
- 7809 24th Ave
- 2352 79th St
- 78-7 24th Ave
- 7807 24th Ave
- 2359 White Oak Ct
- 2357 White Oak Ct
- 2355 White Oak Ct Unit 23
- 2355 White Oak Ct