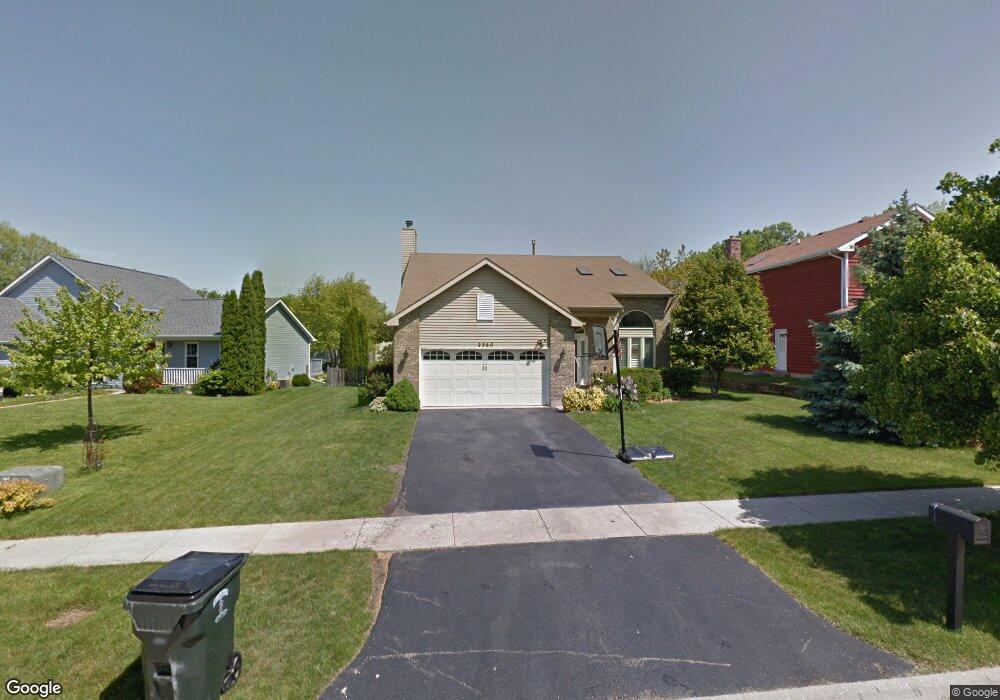
2360 Potomac Ct Lindenhurst, IL 60046
Estimated Value: $358,000 - $410,000
3
Beds
3
Baths
1,892
Sq Ft
$207/Sq Ft
Est. Value
About This Home
This home is located at 2360 Potomac Ct, Lindenhurst, IL 60046 and is currently estimated at $392,313, approximately $207 per square foot. 2360 Potomac Ct is a home located in Lake County with nearby schools including Lakes Community High School.
Ownership History
Date
Name
Owned For
Owner Type
Purchase Details
Closed on
Aug 27, 2004
Sold by
Hoerle William S
Bought by
Girona Elvin and Girona Jama
Current Estimated Value
Home Financials for this Owner
Home Financials are based on the most recent Mortgage that was taken out on this home.
Original Mortgage
$254,900
Outstanding Balance
$127,966
Interest Rate
6.08%
Mortgage Type
Purchase Money Mortgage
Estimated Equity
$264,348
Purchase Details
Closed on
Jul 14, 1999
Sold by
Kornak John A and Kornak Christine L
Bought by
Hoerle William S
Home Financials for this Owner
Home Financials are based on the most recent Mortgage that was taken out on this home.
Original Mortgage
$174,400
Interest Rate
5.55%
Purchase Details
Closed on
May 28, 1996
Sold by
State Bank Of Countryside
Bought by
Kornak John A and Kornak Christine L
Home Financials for this Owner
Home Financials are based on the most recent Mortgage that was taken out on this home.
Original Mortgage
$126,000
Interest Rate
7.99%
Create a Home Valuation Report for This Property
The Home Valuation Report is an in-depth analysis detailing your home's value as well as a comparison with similar homes in the area
Home Values in the Area
Average Home Value in this Area
Purchase History
| Date | Buyer | Sale Price | Title Company |
|---|---|---|---|
| Girona Elvin | $255,000 | St | |
| Hoerle William S | $194,000 | First American Title | |
| Kornak John A | $176,500 | Chicago Title Insurance Co |
Source: Public Records
Mortgage History
| Date | Status | Borrower | Loan Amount |
|---|---|---|---|
| Open | Girona Elvin | $254,900 | |
| Previous Owner | Hoerle William S | $174,400 | |
| Previous Owner | Kornak John A | $126,000 |
Source: Public Records
Tax History Compared to Growth
Tax History
| Year | Tax Paid | Tax Assessment Tax Assessment Total Assessment is a certain percentage of the fair market value that is determined by local assessors to be the total taxable value of land and additions on the property. | Land | Improvement |
|---|---|---|---|---|
| 2024 | $10,578 | $116,702 | $13,627 | $103,075 |
| 2023 | $8,907 | $103,112 | $12,040 | $91,072 |
| 2022 | $8,907 | $84,002 | $9,143 | $74,859 |
| 2021 | $8,470 | $78,032 | $8,493 | $69,539 |
| 2020 | $8,790 | $79,817 | $8,687 | $71,130 |
| 2019 | $9,007 | $76,710 | $8,349 | $68,361 |
| 2018 | $8,737 | $77,191 | $14,250 | $62,941 |
| 2017 | $8,505 | $75,132 | $13,870 | $61,262 |
| 2016 | $8,682 | $72,089 | $13,308 | $58,781 |
| 2015 | $8,301 | $67,329 | $12,429 | $54,900 |
| 2014 | $8,672 | $64,884 | $12,487 | $52,397 |
| 2012 | $8,064 | $76,033 | $14,085 | $61,948 |
Source: Public Records
Map
Nearby Homes
- 697 Providence Ln
- 2726 Providence Ln
- 527 Northgate Rd Unit 28
- 684 N Autumn Cir
- 1896 E Vista Terrace
- 586 Harvard Ct
- 418 Surrey Ln
- 419 Northgate Rd Unit 27
- 20215 W Miller Rd
- 1650 Natures Way
- 725 Porter Cir
- 19135 W Millburn Rd
- 3087 Haven Ln
- 2105 Sprucewood Ln
- 1903 S Shore Cove
- 1924 S Shore Cove
- 1772 S Port Dr
- 1768 S Port Dr
- 77 Bridlepath Dr
- 420 Woodland Trail
- 2348 Potomac Ct
- 2380 Potomac Ct
- 740 N Beck Rd
- 748 N Beck Rd
- 2336 Potomac Ct
- 2373 Potomac Ct
- 756 N Beck Rd
- 2345 Potomac Ct
- 2361 Potomac Ct
- 2387 Potomac Ct
- 730 Monroe Dr
- 720 Monroe Dr
- 738 Monroe Dr
- 2335 Potomac Ct
- 764 N Beck Rd
- 2324 Potomac Ct
- 772 N Beck Rd
- 756 Monroe Dr
- 2325 Potomac Ct
- 702 Monroe Dr Unit 1