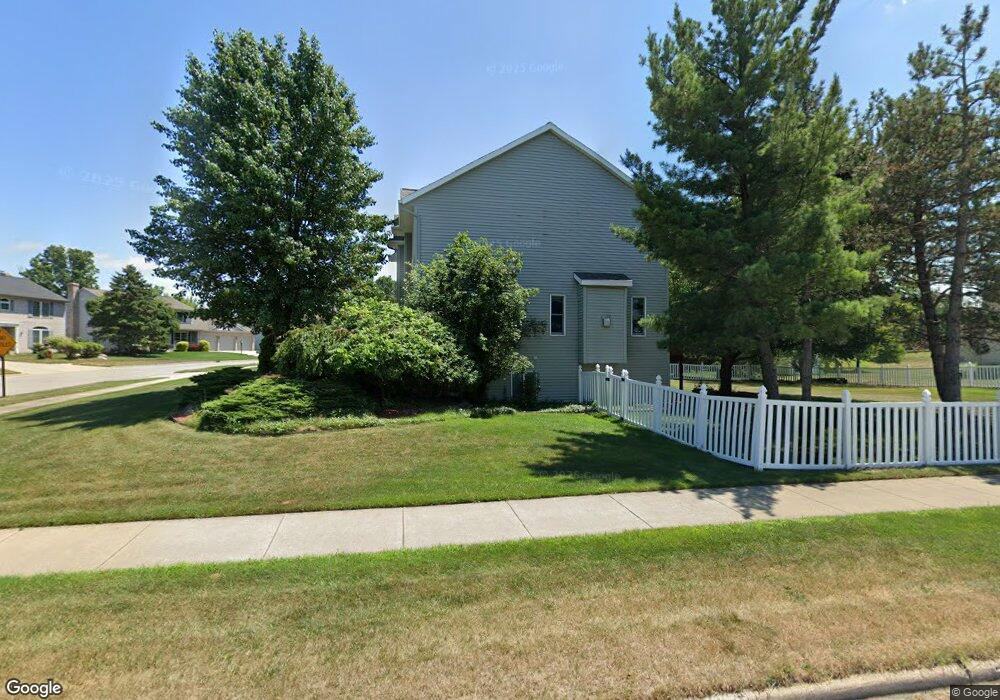
2360 Vicksburg Ct SE Grand Rapids, MI 49508
Princeton Estates NeighborhoodEstimated Value: $401,423 - $458,000
4
Beds
3
Baths
2,220
Sq Ft
$199/Sq Ft
Est. Value
About This Home
This home is located at 2360 Vicksburg Ct SE, Grand Rapids, MI 49508 and is currently estimated at $441,356, approximately $198 per square foot. 2360 Vicksburg Ct SE is a home located in Kent County with nearby schools including Challenger Elementary, Crestwood Middle School, and East Kentwood Freshman Campus.
Ownership History
Date
Name
Owned For
Owner Type
Purchase Details
Closed on
Aug 12, 2010
Sold by
Benner Jennifer L
Bought by
Thang Bay
Current Estimated Value
Purchase Details
Closed on
Aug 11, 2010
Sold by
Poleski Lawrence and Poleski Lawrence B
Bought by
Benner Jennifer L
Purchase Details
Closed on
Jun 23, 2010
Sold by
Benner Jennifer L and Poleski Lawrence
Bought by
Federal Home Loan Mortgage Corp
Purchase Details
Closed on
May 28, 2004
Sold by
Vandyke John D and Vandyke Jacqueline R
Bought by
Poleski Lawrence and Benner Jennifer L
Home Financials for this Owner
Home Financials are based on the most recent Mortgage that was taken out on this home.
Original Mortgage
$214,225
Interest Rate
6.17%
Mortgage Type
Purchase Money Mortgage
Create a Home Valuation Report for This Property
The Home Valuation Report is an in-depth analysis detailing your home's value as well as a comparison with similar homes in the area
Home Values in the Area
Average Home Value in this Area
Purchase History
| Date | Buyer | Sale Price | Title Company |
|---|---|---|---|
| Thang Bay | $157,500 | None Available | |
| Benner Jennifer L | -- | None Available | |
| Federal Home Loan Mortgage Corp | $158,500 | None Available | |
| Poleski Lawrence | $225,500 | Metropolitan Title Company |
Source: Public Records
Mortgage History
| Date | Status | Borrower | Loan Amount |
|---|---|---|---|
| Previous Owner | Poleski Lawrence | $214,225 |
Source: Public Records
Tax History Compared to Growth
Tax History
| Year | Tax Paid | Tax Assessment Tax Assessment Total Assessment is a certain percentage of the fair market value that is determined by local assessors to be the total taxable value of land and additions on the property. | Land | Improvement |
|---|---|---|---|---|
| 2025 | $3,706 | $181,800 | $0 | $0 |
| 2024 | $3,706 | $175,700 | $0 | $0 |
| 2023 | $3,947 | $153,700 | $0 | $0 |
| 2022 | $3,694 | $138,700 | $0 | $0 |
| 2021 | $3,622 | $131,700 | $0 | $0 |
| 2020 | $3,006 | $121,700 | $0 | $0 |
| 2019 | $3,465 | $114,900 | $0 | $0 |
| 2018 | $3,465 | $106,000 | $0 | $0 |
| 2017 | $3,374 | $101,000 | $0 | $0 |
| 2016 | $3,269 | $94,200 | $0 | $0 |
| 2015 | $3,154 | $94,200 | $0 | $0 |
| 2013 | -- | $86,600 | $0 | $0 |
Source: Public Records
Map
Nearby Homes
- 2294 Charleston Ct SE
- 2265 Old Dominion Ct SE
- 5402 Bunker Hill Ct SE
- 2328 Bridle Creek St SE
- 5069 Stauffer Ave SE
- 5391 Ticonderoga Dr SE
- 2502 Thorn Creek St SE
- 5033 Stauffer Ave SE Unit 95
- 2492 Sunny Creek St SE
- 2565 Thorn Creek St SE
- 2075 Waterbury Dr SE
- 5064 Maple Creek Ave SE
- 2496 Promise Dr SE
- 4928 Weatherstone Ln SE
- 2067 Fawnwood Dr SE
- 2651 Blooming Bud SE
- 2710 Sanderling Ct SE
- 2651 Blooming Bud Ln
- 1865 Gentian Dr SE
- 4670 Larkwood Dr SE
- 5290 Stauffer Ave SE
- 2327 Charleston Ct SE
- 2392 Vicksburg Ct SE
- 2363 Vicksburg Ct SE
- 2328 Charleston Ct SE
- 2375 Vicksburg Ct SE
- 2381 Vicksburg Ct SE
- 5320 Discovery Dr SE
- 5249 Stauffer Ave SE
- 2389 Vicksburg Ct SE
- 2315 Charleston Ct SE
- 2398 Vicksburg Ct SE
- 2316 Charleston Ct SE
- 5300 Discovery Dr SE
- 5332 Discovery Dr SE
- 5237 Stauffer Ave SE
- 2395 Vicksburg Ct SE
- 5292 Discovery Dr SE
- 2309 Charleston Ct SE
- 2310 Charleston Ct SE