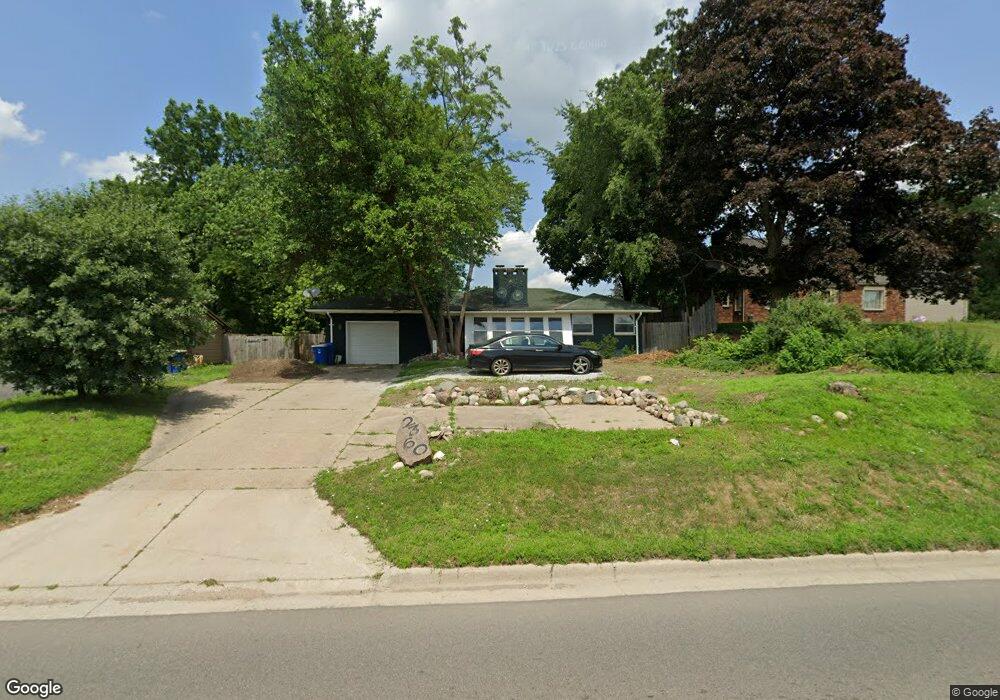
2360 W Walton Blvd Unit Bldg-Unit Waterford, MI 48329
Waterford Township NeighborhoodEstimated Value: $289,000 - $347,000
2
Beds
2
Baths
1,534
Sq Ft
$209/Sq Ft
Est. Value
About This Home
This home is located at 2360 W Walton Blvd Unit Bldg-Unit, Waterford, MI 48329 and is currently estimated at $320,239, approximately $208 per square foot. 2360 W Walton Blvd Unit Bldg-Unit is a home located in Oakland County with nearby schools including Grayson Elementary, Mason Middle School, and Waterford Mott High School.
Ownership History
Date
Name
Owned For
Owner Type
Purchase Details
Closed on
Mar 30, 2018
Sold by
Yousilf Joseph Peter and Shahini Sarintaj
Bought by
Greig James
Current Estimated Value
Purchase Details
Closed on
Dec 13, 2016
Sold by
Deutsche Bank National Trust Co
Bought by
Yousif Yousif and Shahini Zarintaj
Purchase Details
Closed on
Oct 20, 2015
Sold by
Lush Mike E
Bought by
Deutsche Bank National Trust Company
Purchase Details
Closed on
Feb 19, 1998
Sold by
Robbins Brook B
Bought by
Lush Michael E
Home Financials for this Owner
Home Financials are based on the most recent Mortgage that was taken out on this home.
Original Mortgage
$86,950
Interest Rate
7.09%
Purchase Details
Closed on
Oct 11, 1995
Sold by
Dey Andrea C
Bought by
Robbins Brook B
Home Financials for this Owner
Home Financials are based on the most recent Mortgage that was taken out on this home.
Original Mortgage
$85,400
Interest Rate
7.68%
Create a Home Valuation Report for This Property
The Home Valuation Report is an in-depth analysis detailing your home's value as well as a comparison with similar homes in the area
Home Values in the Area
Average Home Value in this Area
Purchase History
| Date | Buyer | Sale Price | Title Company |
|---|---|---|---|
| Greig James | $179,000 | Devon Title Agency | |
| Yousif Yousif | $56,729 | None Available | |
| Deutsche Bank National Trust Company | $146,993 | Attorney | |
| Lush Michael E | -- | -- | |
| Robbins Brook B | $89,900 | -- |
Source: Public Records
Mortgage History
| Date | Status | Borrower | Loan Amount |
|---|---|---|---|
| Previous Owner | Lush Michael E | $86,950 | |
| Previous Owner | Robbins Brook B | $85,400 |
Source: Public Records
Tax History Compared to Growth
Tax History
| Year | Tax Paid | Tax Assessment Tax Assessment Total Assessment is a certain percentage of the fair market value that is determined by local assessors to be the total taxable value of land and additions on the property. | Land | Improvement |
|---|---|---|---|---|
| 2024 | $2,548 | $141,350 | $0 | $0 |
| 2023 | $2,431 | $128,250 | $0 | $0 |
| 2022 | $4,823 | $120,600 | $0 | $0 |
| 2021 | $3,968 | $113,690 | $0 | $0 |
| 2020 | $2,225 | $108,830 | $0 | $0 |
| 2019 | $4,006 | $101,490 | $0 | $0 |
| 2018 | $2,443 | $60,660 | $0 | $0 |
| 2017 | $3,153 | $60,660 | $0 | $0 |
| 2016 | $2,503 | $55,700 | $0 | $0 |
| 2015 | -- | $48,680 | $0 | $0 |
| 2014 | -- | $42,740 | $0 | $0 |
| 2011 | -- | $37,060 | $0 | $0 |
Source: Public Records
Map
Nearby Homes
- 2831 Silverstone Ln
- 2550 W Walton Blvd
- 2927 Huntington Park Dr
- 2854 Beacham Dr
- 2361 Montroyal Ave
- 2830 Dixie Hwy
- 3411 Wormer Dr
- 940 Lake Angelus Shores Rd
- 3039 Mccormick Dr
- 3053 Mccormick Dr
- 405 W Walton Blvd
- 3289 Schoolhouse Dr
- 1842 Colonial Village Way Unit 4
- 000 W Walton Blvd
- LOT 2 W Walton Blvd
- LOT 1 W Walton Blvd
- LOT 3 W Walton Blvd
- 1806 Colonial Village Way Unit 3
- 3432 Loon Lake Ct
- 3416 Loon Lake Ct
- 2360 W Walton Blvd
- 2350 W Walton Blvd
- 2368 W Walton Blvd
- 2327 Winkleman Dr
- 2345 Winkleman Dr
- 2361 Winkleman Dr
- 2330 W Walton Blvd
- 2370 W Walton Blvd
- 2365 W Walton Blvd
- 2381 Winkleman Dr
- 2390 W Walton Blvd
- 2330 Winkleman Dr
- 2349 W Walton Blvd
- _2340_ _winkleman Dr_
- 2377 W Walton Blvd
- 2339 W Walton Blvd
- 2340 Winkleman Dr
- 2610 Ironton Dr
- 2397 Winkleman Dr
- 2385 W Walton Blvd