23600 Joy Rd Redford, MI 48239
Estimated Value: $200,000 - $241,000
--
Bed
1
Bath
1,330
Sq Ft
$167/Sq Ft
Est. Value
About This Home
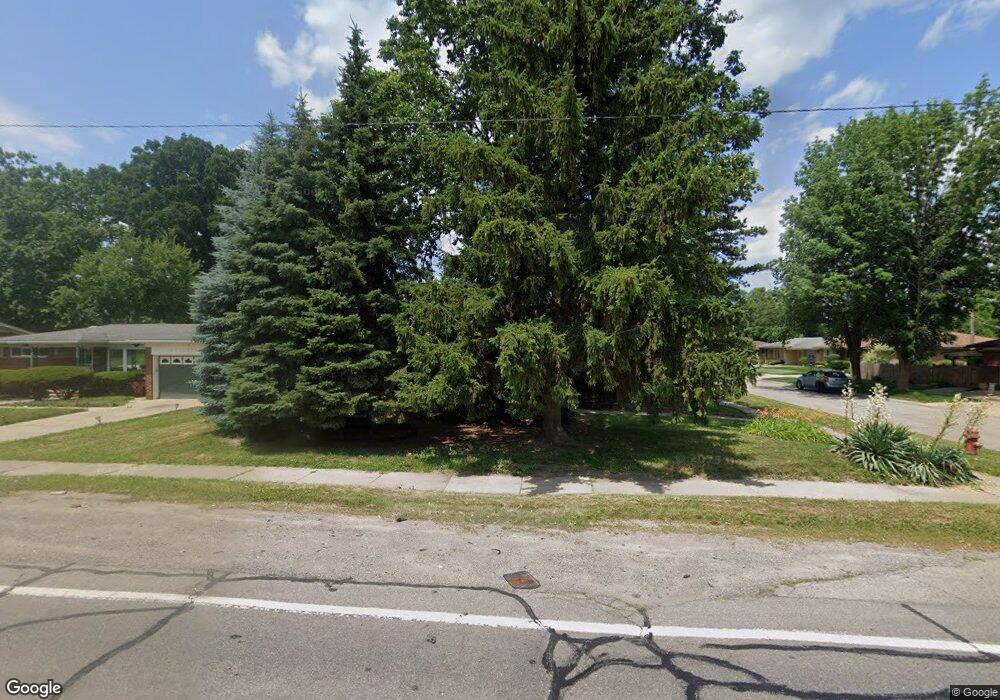
This home is located at 23600 Joy Rd, Redford, MI 48239 and is currently estimated at $222,268, approximately $167 per square foot. 23600 Joy Rd is a home located in Wayne County with nearby schools including John D. Pierce Middle School, Lee M. Thurston High School, and Global Heights Academy.
Ownership History
Date
Name
Owned For
Owner Type
Purchase Details
Closed on
Jan 29, 2014
Sold by
Holmes Annie
Bought by
Holmes Annie
Current Estimated Value
Purchase Details
Closed on
Oct 3, 2006
Sold by
Citibank Na
Bought by
Homesales Inc
Purchase Details
Closed on
Feb 14, 2006
Sold by
Chase Manhattan Mortgage Corp
Bought by
Citibank Na
Purchase Details
Closed on
Feb 8, 2006
Sold by
Earl Dwayne H and Chase Manhattan Mortgage Corp
Bought by
Chase Home Finance Llc
Purchase Details
Closed on
Jul 13, 2004
Sold by
Earl Dwayne
Bought by
Chase Manhattan Mortgage Corp
Create a Home Valuation Report for This Property
The Home Valuation Report is an in-depth analysis detailing your home's value as well as a comparison with similar homes in the area
Home Values in the Area
Average Home Value in this Area
Purchase History
| Date | Buyer | Sale Price | Title Company |
|---|---|---|---|
| Holmes Annie | -- | None Available | |
| Homesales Inc | -- | None Available | |
| Citibank Na | -- | None Available | |
| Chase Home Finance Llc | $160,000 | None Available | |
| Chase Manhattan Mortgage Corp | $127,800 | -- | |
| Garrett Cathy M | $127,800 | -- |
Source: Public Records
Tax History Compared to Growth
Tax History
| Year | Tax Paid | Tax Assessment Tax Assessment Total Assessment is a certain percentage of the fair market value that is determined by local assessors to be the total taxable value of land and additions on the property. | Land | Improvement |
|---|---|---|---|---|
| 2025 | $2,415 | $107,500 | $0 | $0 |
| 2024 | $2,415 | $95,700 | $0 | $0 |
| 2023 | $2,309 | $82,600 | $0 | $0 |
| 2022 | $5,857 | $70,700 | $0 | $0 |
| 2021 | $10,111 | $67,800 | $0 | $0 |
| 2020 | $2,256 | $60,200 | $0 | $0 |
| 2019 | $2,208 | $45,800 | $0 | $0 |
| 2018 | $726 | $38,000 | $0 | $0 |
| 2017 | $2,512 | $35,000 | $0 | $0 |
| 2016 | $1,958 | $32,600 | $0 | $0 |
| 2015 | $3,050 | $30,500 | $0 | $0 |
| 2013 | $3,090 | $31,600 | $0 | $0 |
| 2012 | $1,994 | $35,000 | $7,500 | $27,500 |
Source: Public Records
Map
Nearby Homes