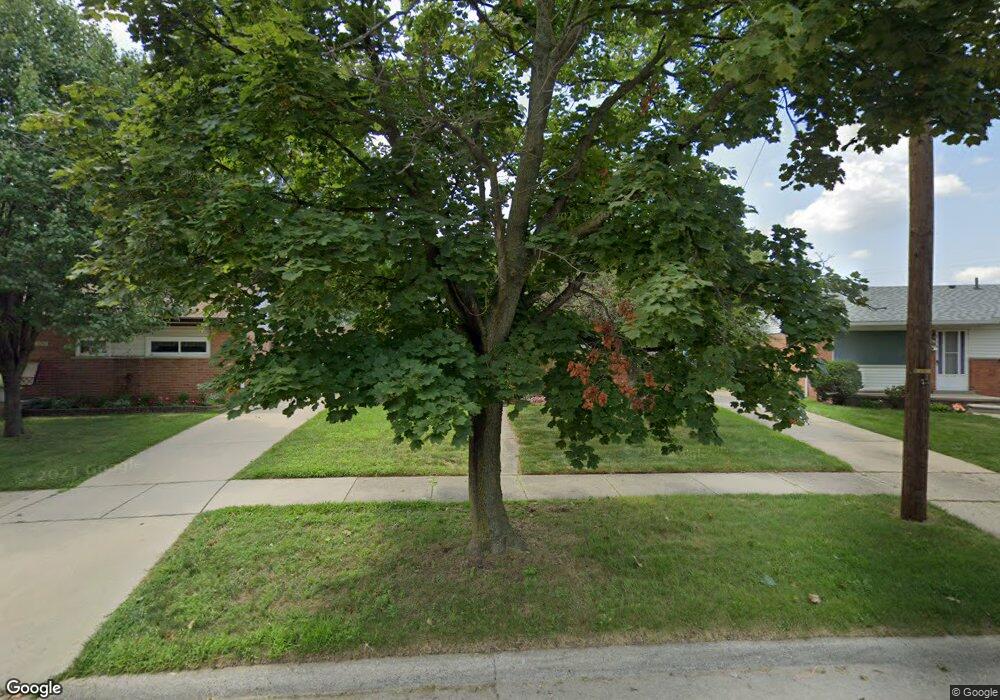
23611 Calvin St Taylor, MI 48180
Estimated Value: $193,888 - $230,000
--
Bed
2
Baths
1,332
Sq Ft
$159/Sq Ft
Est. Value
About This Home
This home is located at 23611 Calvin St, Taylor, MI 48180 and is currently estimated at $211,222, approximately $158 per square foot. 23611 Calvin St is a home located in Wayne County with nearby schools including Clarence Randall Elementary School, Robert J. West Middle School, and Taylor High School.
Ownership History
Date
Name
Owned For
Owner Type
Purchase Details
Closed on
Dec 31, 2012
Sold by
Klochack Andrea N and The Deborah L Young Living Tru
Bought by
Klochack Keith and Klochack Andrea
Current Estimated Value
Purchase Details
Closed on
Jan 27, 2010
Sold by
Young Deborah L
Bought by
The Deborah L Young Living Trust
Purchase Details
Closed on
Dec 7, 2007
Sold by
Young Elizabeth
Bought by
Young Deborah L
Purchase Details
Closed on
Dec 30, 2005
Sold by
Young Deborah L
Bought by
Young Elizabeth
Purchase Details
Closed on
Aug 25, 2005
Sold by
Young Deborah L and Mortgage Electronic Registrati
Bought by
Empire Assets Llc
Purchase Details
Closed on
Jan 20, 1999
Sold by
Kay M Clark
Bought by
Deborah L Young
Purchase Details
Closed on
Oct 19, 1994
Sold by
Clark William A
Bought by
Young Deborah L
Create a Home Valuation Report for This Property
The Home Valuation Report is an in-depth analysis detailing your home's value as well as a comparison with similar homes in the area
Home Values in the Area
Average Home Value in this Area
Purchase History
| Date | Buyer | Sale Price | Title Company |
|---|---|---|---|
| Klochack Keith | $42,000 | Fidelity Natl Title Ins Co | |
| The Deborah L Young Living Trust | -- | None Available | |
| Young Deborah L | -- | Multiple | |
| Young Elizabeth | $92,000 | Multiple | |
| Empire Assets Llc | $60,940 | None Available | |
| Deborah L Young | $75,000 | -- | |
| Young Deborah L | $75,000 | -- |
Source: Public Records
Mortgage History
| Date | Status | Borrower | Loan Amount |
|---|---|---|---|
| Closed | Young Deborah L | $0 |
Source: Public Records
Tax History Compared to Growth
Tax History
| Year | Tax Paid | Tax Assessment Tax Assessment Total Assessment is a certain percentage of the fair market value that is determined by local assessors to be the total taxable value of land and additions on the property. | Land | Improvement |
|---|---|---|---|---|
| 2025 | $3,289 | $118,500 | $0 | $0 |
| 2024 | $3,289 | $107,000 | $0 | $0 |
| 2023 | $3,688 | $93,900 | $0 | $0 |
| 2022 | $3,093 | $86,900 | $0 | $0 |
| 2021 | $3,653 | $78,600 | $0 | $0 |
| 2020 | $3,488 | $68,000 | $0 | $0 |
| 2019 | $350,264 | $58,000 | $0 | $0 |
| 2018 | $2,716 | $48,500 | $0 | $0 |
| 2017 | $1,611 | $45,600 | $0 | $0 |
| 2016 | $3,292 | $44,300 | $0 | $0 |
| 2015 | $4,308 | $45,000 | $0 | $0 |
| 2013 | $4,290 | $43,700 | $0 | $0 |
| 2012 | $1,889 | $43,800 | $12,400 | $31,400 |
Source: Public Records
Map
Nearby Homes
- 23619 Calvin St
- 23603 Calvin St
- 23595 Calvin St
- 23627 Calvin St
- 23730 Irving St
- 23744 Irving St
- 23712 Irving St
- 23702 Irving St
- 23754 Irving St
- 23587 Calvin St
- 23698 Irving St
- 23672 Irving St
- 23604 Calvin St
- 23764 Irving St
- 23656 Irving St
- 23626 Calvin St
- 23641 Filmore St
- 23646 Irving St
- 23705 Filmore St
- 23579 Calvin St