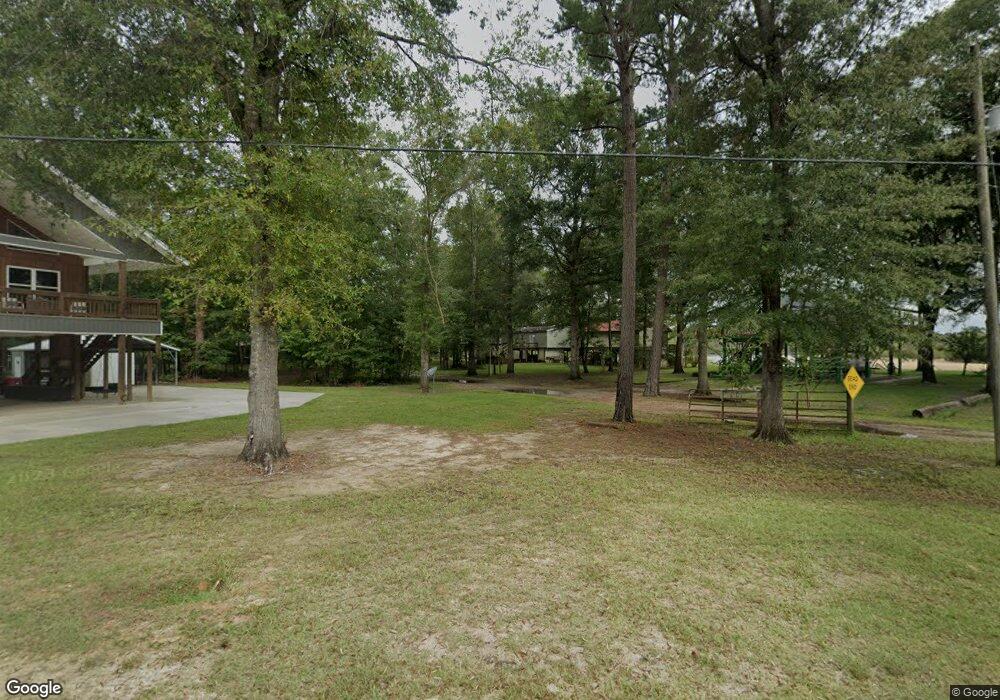
2363 Carter Bight Landing Rd Surrency, GA 31563
Estimated Value: $262,000 - $307,000
--
Bed
--
Bath
1,800
Sq Ft
$161/Sq Ft
Est. Value
About This Home
This home is located at 2363 Carter Bight Landing Rd, Surrency, GA 31563 and is currently estimated at $289,723, approximately $160 per square foot. 2363 Carter Bight Landing Rd is a home.
Ownership History
Date
Name
Owned For
Owner Type
Purchase Details
Closed on
Oct 10, 2016
Sold by
Michael K
Bought by
Barnes Mark T
Current Estimated Value
Purchase Details
Closed on
Apr 26, 2010
Sold by
Eason James S
Bought by
Perkins Michael K and Perkins Glenda E
Purchase Details
Closed on
Jun 25, 2002
Sold by
Williams Benny Richie
Bought by
Harris Larry L and Harris Janice
Purchase Details
Closed on
Nov 10, 1999
Bought by
Williams Benny Richie
Create a Home Valuation Report for This Property
The Home Valuation Report is an in-depth analysis detailing your home's value as well as a comparison with similar homes in the area
Home Values in the Area
Average Home Value in this Area
Purchase History
| Date | Buyer | Sale Price | Title Company |
|---|---|---|---|
| Barnes Mark T | $169,000 | -- | |
| Perkins Michael K | $143,000 | -- | |
| Harris Larry L | $91,000 | -- | |
| Williams Benny Richie | $22,000 | -- |
Source: Public Records
Tax History Compared to Growth
Tax History
| Year | Tax Paid | Tax Assessment Tax Assessment Total Assessment is a certain percentage of the fair market value that is determined by local assessors to be the total taxable value of land and additions on the property. | Land | Improvement |
|---|---|---|---|---|
| 2024 | $2,620 | $106,680 | $19,800 | $86,880 |
| 2023 | $2,620 | $106,680 | $19,800 | $86,880 |
| 2022 | $2,241 | $51,593 | $13,320 | $38,273 |
| 2021 | $1,332 | $51,593 | $13,320 | $38,273 |
| 2020 | $1,383 | $51,593 | $13,320 | $38,273 |
| 2019 | $1,411 | $51,593 | $13,320 | $38,273 |
| 2018 | $1,436 | $51,593 | $13,320 | $38,273 |
| 2017 | $1,437 | $51,593 | $13,320 | $38,273 |
| 2016 | $1,329 | $47,719 | $8,880 | $38,839 |
| 2015 | $1,331 | $47,719 | $8,880 | $38,839 |
| 2014 | $1,334 | $47,719 | $8,880 | $38,839 |
| 2013 | -- | $53,148 | $11,100 | $42,048 |
Source: Public Records
Map
Nearby Homes
- 2262 Carter Bight Landing Rd
- 2264 Carter Bight Landing Rd
- 145 Getaway Ln
- 315 Getaway Ln
- 0 Lee Woods Rd Unit 18062646
- 0 Lee Woods Rd Unit 11355226
- 9027 Georgia 144
- 963 Oak Grove Rd
- 1014 Jiggs Harden Rd
- 189 High Bluff Rd
- 163 High Bluff Rd
- 1758 Eason Bluff Rd
- 1758 Easons Bluff Rd
- 965 Oquinn Loop
- 46 Georgia 178
- 0 Oquinn Loop
- Tbd Baxter Durrence Rd
- Tbd Baxter Durrence Rd
- 9027 Ga Highway 144 NE
- 0 Robert Chapel Cemetery Rd Unit 10519584
- 2323 Carter Bight Landing Rd
- 2347 Carter Bight Landing Rd
- 0 River Loop Rd Unit 29902
- 0 River Loop Rd Unit 29496
- 0 River Loop Rd Unit 28663
- 0 River Loop Rd Unit 28125
- 0 River Loop Rd Unit 8741944
- 0 River Loop Rd Unit 8848681
- 2347 Carter Bite
- 105 River Loop Rd
- 206 River Loop Rd
- 245 River Loop Rd
- 2286 Carter Bight Landing Rd
- 474 River Loop Rd
- 335 River Loop Rd
- 73 Getaway Ln
- 2260 Carter Bight Landing Rd
- 2163 Carter Bight Landing Rd
- 103 Getaway Ln
- 68 Getaway Ln