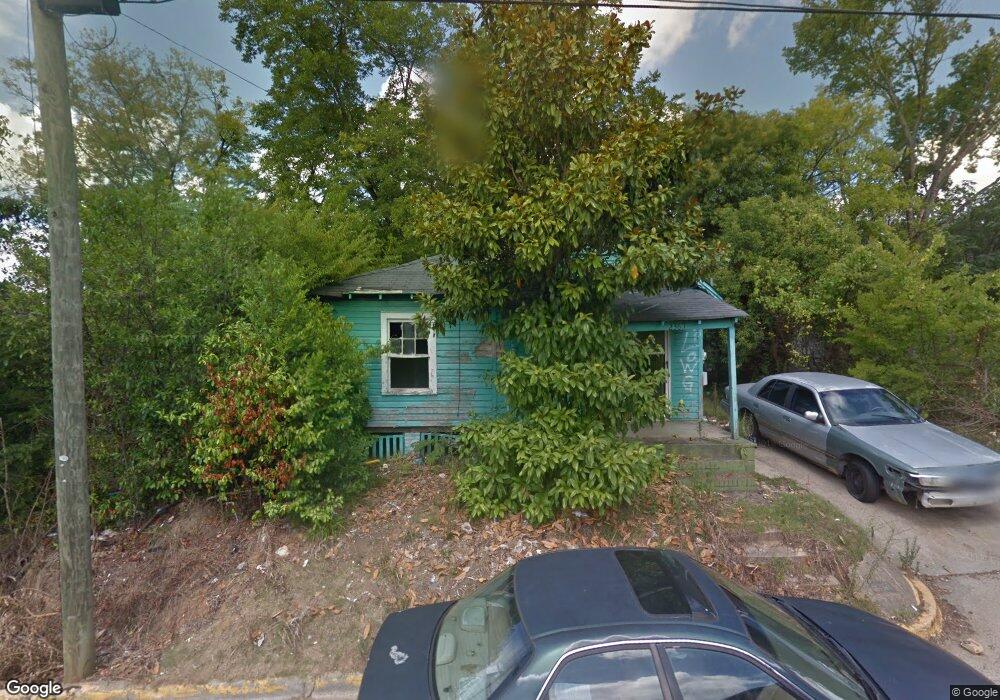
2363 Cedar St Macon, GA 31206
Tindall Heights Historic District NeighborhoodEstimated Value: $24,000 - $65,103
1
Bed
1
Bath
534
Sq Ft
$91/Sq Ft
Est. Value
About This Home
This home is located at 2363 Cedar St, Macon, GA 31206 and is currently estimated at $48,776, approximately $91 per square foot. 2363 Cedar St is a home located in Bibb County with nearby schools including Ingram-Pye Elementary School, Central High School, and Cirrus Charter Academy.
Ownership History
Date
Name
Owned For
Owner Type
Purchase Details
Closed on
Feb 6, 2017
Sold by
Rref Ii Cer Ga Llc
Bought by
Robinson Martin
Current Estimated Value
Purchase Details
Closed on
Oct 9, 2015
Sold by
Cbna Ga Ii Llc
Bought by
Rref Ii Cer Ga Llc
Purchase Details
Closed on
Jun 3, 2014
Sold by
J G & L Enterprises Llc
Bought by
Cbna Ga Ii Llc
Purchase Details
Closed on
Jul 6, 2007
Sold by
Flowers James A
Bought by
Jg&L Enterprises Llc
Home Financials for this Owner
Home Financials are based on the most recent Mortgage that was taken out on this home.
Original Mortgage
$39,000
Interest Rate
6.52%
Mortgage Type
Purchase Money Mortgage
Purchase Details
Closed on
Aug 4, 2005
Sold by
Powell Elton L
Bought by
Flowers James A
Create a Home Valuation Report for This Property
The Home Valuation Report is an in-depth analysis detailing your home's value as well as a comparison with similar homes in the area
Home Values in the Area
Average Home Value in this Area
Purchase History
| Date | Buyer | Sale Price | Title Company |
|---|---|---|---|
| Robinson Martin | $8,000 | -- | |
| Rref Ii Cer Ga Llc | $9,498 | -- | |
| Cbna Ga Ii Llc | $32,655 | None Available | |
| Cbna-Ga Ii Llc | $32,700 | -- | |
| Jg&L Enterprises Llc | $36,000 | None Available | |
| Flowers James A | $25,000 | -- |
Source: Public Records
Mortgage History
| Date | Status | Borrower | Loan Amount |
|---|---|---|---|
| Previous Owner | Jg&L Enterprises Llc | $39,000 |
Source: Public Records
Tax History
| Year | Tax Paid | Tax Assessment Tax Assessment Total Assessment is a certain percentage of the fair market value that is determined by local assessors to be the total taxable value of land and additions on the property. | Land | Improvement |
|---|---|---|---|---|
| 2025 | $58 | $2,353 | $1,400 | $953 |
| 2024 | $60 | $2,353 | $1,400 | $953 |
| 2023 | $60 | $2,353 | $1,400 | $953 |
| 2022 | $81 | $2,335 | $1,493 | $842 |
| 2021 | $89 | $2,335 | $1,493 | $842 |
| 2020 | $91 | $2,335 | $1,493 | $842 |
| 2019 | $91 | $2,335 | $1,493 | $842 |
| 2018 | $291 | $2,335 | $1,493 | $842 |
| 2017 | $174 | $4,642 | $1,493 | $3,149 |
| 2016 | $161 | $4,642 | $1,493 | $3,149 |
| 2015 | $227 | $4,642 | $1,493 | $3,149 |
| 2014 | $261 | $4,642 | $1,493 | $3,149 |
Source: Public Records
Map
Nearby Homes
Your Personal Tour Guide
Ask me questions while you tour the home.