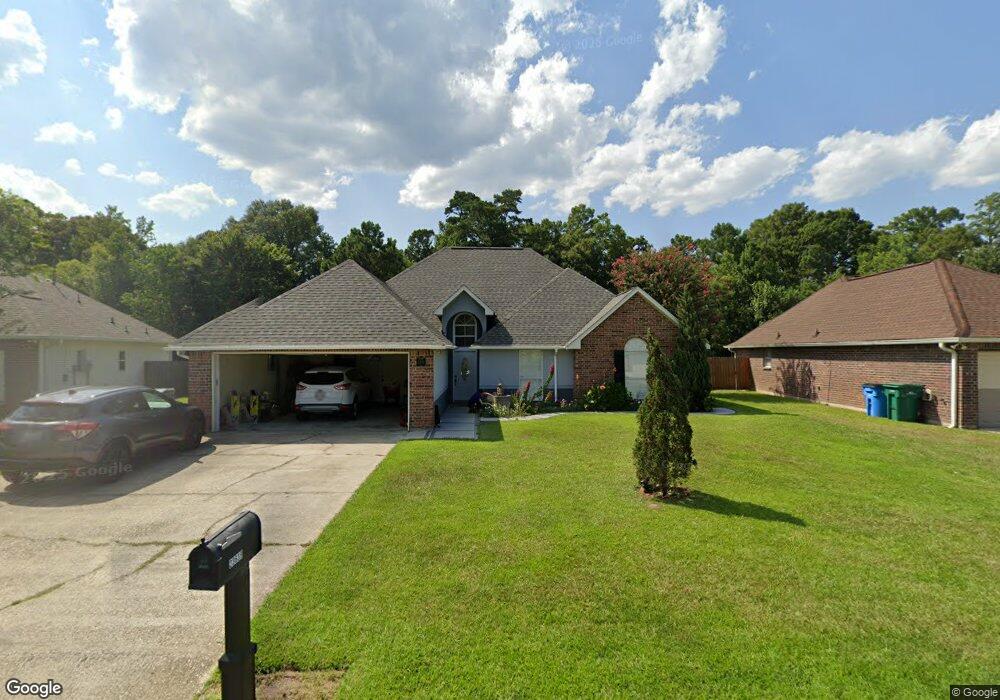
23639 S Point Dr Denham Springs, LA 70726
Estimated Value: $214,000 - $250,000
3
Beds
2
Baths
1,948
Sq Ft
$121/Sq Ft
Est. Value
About This Home
This home is located at 23639 S Point Dr, Denham Springs, LA 70726 and is currently estimated at $236,048, approximately $121 per square foot. 23639 S Point Dr is a home located in Livingston Parish with nearby schools including Seventh Ward Elementary School, Juban Parc Junior High School, and Denham Springs Freshman High School.
Ownership History
Date
Name
Owned For
Owner Type
Purchase Details
Closed on
Dec 8, 2023
Sold by
Miller Patricia Moritz and Miller Wesley S
Bought by
Miller Arie and Miller Zachary
Current Estimated Value
Purchase Details
Closed on
Sep 24, 2007
Sold by
Cagle Joshua W and Cagle Carrie Alicia
Bought by
Perez Antono G and Garcia Jose L
Home Financials for this Owner
Home Financials are based on the most recent Mortgage that was taken out on this home.
Original Mortgage
$116,500
Interest Rate
6.55%
Mortgage Type
New Conventional
Purchase Details
Closed on
Aug 31, 2006
Sold by
Gremillion Timmins Christian Michael and Gremillion Timmins Christen
Bought by
Cagle Joshua W and Cagle Carrie Alicia
Home Financials for this Owner
Home Financials are based on the most recent Mortgage that was taken out on this home.
Original Mortgage
$165,000
Interest Rate
6.64%
Mortgage Type
New Conventional
Create a Home Valuation Report for This Property
The Home Valuation Report is an in-depth analysis detailing your home's value as well as a comparison with similar homes in the area
Home Values in the Area
Average Home Value in this Area
Purchase History
| Date | Buyer | Sale Price | Title Company |
|---|---|---|---|
| Miller Arie | $260,000 | None Listed On Document | |
| Perez Antono G | $176,500 | Milestone Title Inc | |
| Cagle Joshua W | $166,000 | Milestone Title Inc |
Source: Public Records
Mortgage History
| Date | Status | Borrower | Loan Amount |
|---|---|---|---|
| Previous Owner | Perez Antono G | $116,500 | |
| Previous Owner | Cagle Joshua W | $165,000 |
Source: Public Records
Tax History Compared to Growth
Tax History
| Year | Tax Paid | Tax Assessment Tax Assessment Total Assessment is a certain percentage of the fair market value that is determined by local assessors to be the total taxable value of land and additions on the property. | Land | Improvement |
|---|---|---|---|---|
| 2024 | $2,169 | $21,206 | $1,890 | $19,316 |
| 2023 | $1,753 | $15,530 | $1,890 | $13,640 |
| 2022 | $1,766 | $15,530 | $1,890 | $13,640 |
| 2021 | $1,539 | $15,530 | $1,890 | $13,640 |
| 2020 | $1,530 | $15,530 | $1,890 | $13,640 |
| 2019 | $1,435 | $14,190 | $1,890 | $12,300 |
| 2018 | $1,456 | $14,190 | $1,890 | $12,300 |
| 2017 | $1,388 | $13,580 | $1,890 | $11,690 |
| 2015 | $1,612 | $15,930 | $1,890 | $14,040 |
| 2014 | $1,638 | $15,930 | $1,890 | $14,040 |
Source: Public Records
Map
Nearby Homes
- 23644 Southpoint Dr
- 23621 S Point Dr
- 23597 S Point Dr
- 23679 Sweetbriar Ct
- 23904 Springhill Dr
- 9053 Hillon Hood Rd
- 11277 Westwood Ave
- TBD Woodlore Ave Unit Tracts B & D
- 23937 S Park Ln
- 23581 Wellington Ave
- 11588 Regal St
- 23532 Wellington Ave
- 20855 Juban Rd
- 9085 Hillon Hood Rd
- 9117 Hillon Hood Rd
- 9189 Hillon Hood Rd
- 9133 Hillon Hood Rd
- 11656 Brown Rd
- 25716 Tarver St
- 25669 Tarver St
- 23639 Southpoint Dr
- 23645 Southpointe Dr
- 23645 Southpoint Dr
- 23633 Southpoint Dr
- 23651 Southpoint Dr
- 23627 Southpoint Dr
- 23638 S Point Dr
- 23638 S Pointe Dr
- 23638 Southpoint Dr
- 23630 Southpoint Dr
- 23657 Southpoint Dr
- 23621 Southpoint Dr
- 23650 Southpoint Dr
- 23622 Southpoint Dr
- 23663 Southpoint Dr
- 23615 Southpoint Dr
- 23615 S Point Dr
- 23656 Southpoint Dr
- 23616 Southpoint Dr
- 23616 S Point Dr