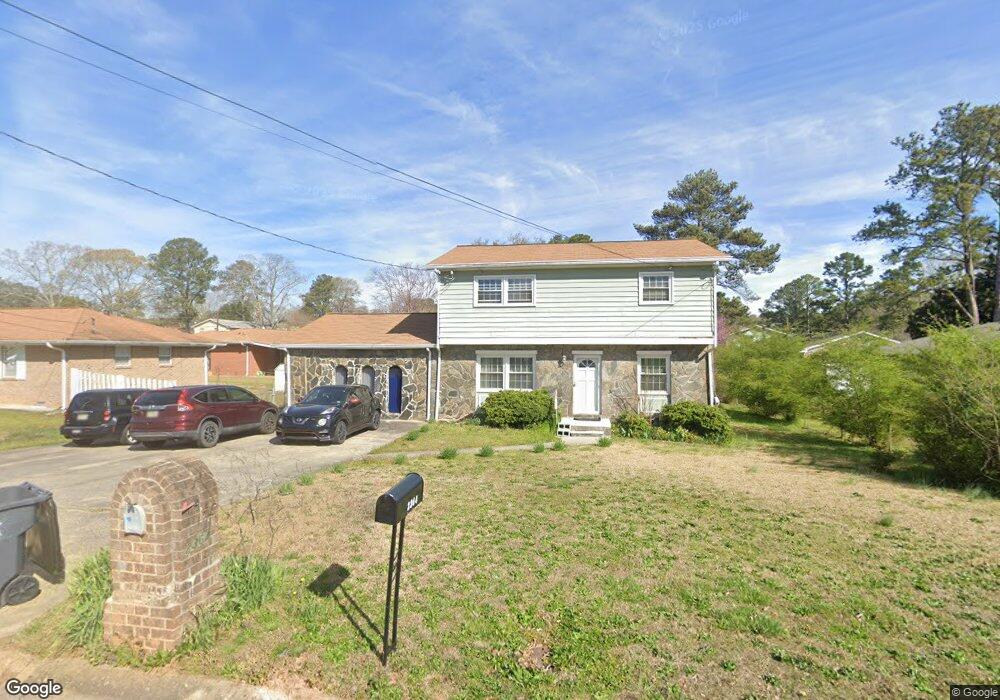
2364 Prestige Square Morrow, GA 30260
Estimated Value: $219,184 - $306,000
3
Beds
3
Baths
2,338
Sq Ft
$109/Sq Ft
Est. Value
About This Home
This home is located at 2364 Prestige Square, Morrow, GA 30260 and is currently estimated at $254,546, approximately $108 per square foot. 2364 Prestige Square is a home located in Clayton County with nearby schools including Thurgood Marshall Elementary School, Morrow Middle School, and Morrow High School.
Ownership History
Date
Name
Owned For
Owner Type
Purchase Details
Closed on
Nov 5, 2009
Sold by
Le Lam A and Le Lam Lien T
Bought by
Le Lam A and Phan Anh-Thu
Current Estimated Value
Purchase Details
Closed on
Jul 28, 2009
Sold by
Bank Of America Na
Bought by
Le Lam A and Le Lam Lien T
Purchase Details
Closed on
Jun 2, 2009
Sold by
Quintanilla Carlos
Bought by
Bank Of America Na
Purchase Details
Closed on
Apr 5, 2006
Sold by
Wm Specialty Mtg Llc
Bought by
Quintanilla Carlos
Home Financials for this Owner
Home Financials are based on the most recent Mortgage that was taken out on this home.
Original Mortgage
$129,500
Interest Rate
6.33%
Mortgage Type
New Conventional
Purchase Details
Closed on
Dec 6, 2005
Sold by
Aughtman Donald E and Aughtman Glenda G
Bought by
W M Specialty Mtg Llc
Create a Home Valuation Report for This Property
The Home Valuation Report is an in-depth analysis detailing your home's value as well as a comparison with similar homes in the area
Home Values in the Area
Average Home Value in this Area
Purchase History
| Date | Buyer | Sale Price | Title Company |
|---|---|---|---|
| Le Lam A | -- | -- | |
| Le Lam A | $35,200 | -- | |
| Bank Of America Na | $42,900 | -- | |
| Quintanilla Carlos | $129,500 | -- | |
| W M Specialty Mtg Llc | $112,713 | -- |
Source: Public Records
Mortgage History
| Date | Status | Borrower | Loan Amount |
|---|---|---|---|
| Previous Owner | Quintanilla Carlos | $129,500 |
Source: Public Records
Tax History
| Year | Tax Paid | Tax Assessment Tax Assessment Total Assessment is a certain percentage of the fair market value that is determined by local assessors to be the total taxable value of land and additions on the property. | Land | Improvement |
|---|---|---|---|---|
| 2025 | $2,911 | $76,000 | $7,200 | $68,800 |
| 2024 | $2,965 | $76,000 | $7,200 | $68,800 |
| 2023 | $1,589 | $76,000 | $7,200 | $68,800 |
| 2022 | $1,727 | $44,000 | $7,040 | $36,960 |
| 2021 | $1,738 | $44,000 | $7,040 | $36,960 |
| 2020 | $1,591 | $46,800 | $7,200 | $39,600 |
| 2019 | $1,687 | $41,556 | $4,800 | $36,756 |
| 2018 | $1,541 | $37,955 | $4,800 | $33,155 |
| 2017 | $1,216 | $29,879 | $4,800 | $25,079 |
| 2016 | $623 | $25,321 | $4,800 | $20,521 |
| 2015 | $625 | $0 | $0 | $0 |
| 2014 | $414 | $20,384 | $6,400 | $13,984 |
Source: Public Records
Map
Nearby Homes
- 2391 Prestige Valley Ct
- 0 Maddox Rd Unit 10674000
- 0 Maddox Rd Unit 183163
- 6203 Castlewood Dr
- 0 Carriage Dr Unit 10652198
- 0 Carriage Dr Unit 7688037
- 6200 Fieldcrest Dr Unit 3
- 2271 Santa fe St Unit 23
- 2316 Santa fe St Unit 5
- 2276 Santa fe St Unit 19
- 2272 Santa fe St Unit 21
- 2144 Carriage Dr
- 2514 Harbin Village Ct
- 2455 Lake Harbin Rd
- 5810 Northfield Dr
- 6359 Lanier Rd
- 2542 Burton Cir
- 2104 Murry Trail
- 5778 Northfield Dr
- 2497 Celina Ct
- 2391 Prestige Square
- 6087 Fairfield Dr
- 2350 Prestige Square
- 6078 Danbury Ct
- 6073 Fairfield Dr
- 6065 Fairfield Dr
- 2363 Prestige Square
- 2355 Prestige Square
- 2371 Prestige Square
- 6062 Danbury Ct
- 6086 Fairfield Dr
- 2347 Prestige Square
- 2379 Prestige Square
- 2338 Prestige Square
- 6074 Fairfield Dr Unit 2
- 6057 Fairfield Dr Unit 2
- 6079 Danbury Ct
- 6068 Fairfield Dr
- 2339 Prestige Square
- 6071 Danbury Ct
Your Personal Tour Guide
Ask me questions while you tour the home.