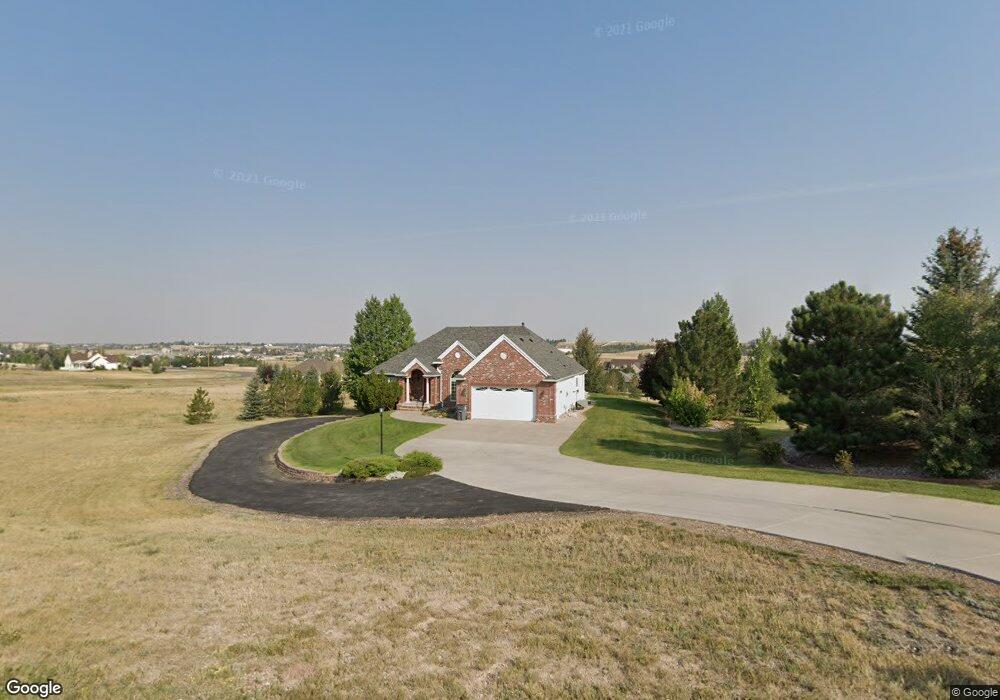
2364 Sweetwater Trail Cheyenne, WY 82009
Estimated Value: $496,000 - $862,000
--
Bed
--
Bath
2,283
Sq Ft
$327/Sq Ft
Est. Value
About This Home
This home is located at 2364 Sweetwater Trail, Cheyenne, WY 82009 and is currently estimated at $746,834, approximately $327 per square foot. 2364 Sweetwater Trail is a home located in Laramie County with nearby schools including Anderson Elementary School, Carey Junior High School, and East High School.
Ownership History
Date
Name
Owned For
Owner Type
Purchase Details
Closed on
Mar 7, 2013
Sold by
Laidlaw Richard and Laidlaw Janet
Bought by
Laidlaw Richard and Laidlaw Janet
Current Estimated Value
Purchase Details
Closed on
Sep 10, 2002
Sold by
Fisher Rick J
Bought by
Laidlaw Richard and Laidlaw Janet
Home Financials for this Owner
Home Financials are based on the most recent Mortgage that was taken out on this home.
Original Mortgage
$200,000
Outstanding Balance
$84,583
Interest Rate
6.41%
Estimated Equity
$662,251
Purchase Details
Closed on
Mar 23, 1999
Sold by
Mustang Ridge Ltd Liability Company
Bought by
Fisher Rick J and Fisher Dianna L
Home Financials for this Owner
Home Financials are based on the most recent Mortgage that was taken out on this home.
Original Mortgage
$22,500
Interest Rate
6.69%
Mortgage Type
Seller Take Back
Create a Home Valuation Report for This Property
The Home Valuation Report is an in-depth analysis detailing your home's value as well as a comparison with similar homes in the area
Home Values in the Area
Average Home Value in this Area
Purchase History
| Date | Buyer | Sale Price | Title Company |
|---|---|---|---|
| Laidlaw Richard | -- | None Available | |
| Laidlaw Richard | -- | -- | |
| Fisher Rick J | -- | -- |
Source: Public Records
Mortgage History
| Date | Status | Borrower | Loan Amount |
|---|---|---|---|
| Open | Laidlaw Richard | $200,000 | |
| Previous Owner | Fisher Rick J | $22,500 |
Source: Public Records
Tax History Compared to Growth
Tax History
| Year | Tax Paid | Tax Assessment Tax Assessment Total Assessment is a certain percentage of the fair market value that is determined by local assessors to be the total taxable value of land and additions on the property. | Land | Improvement |
|---|---|---|---|---|
| 2025 | $4,499 | $32,777 | $7,755 | $25,022 |
| 2024 | $4,499 | $63,629 | $15,510 | $48,119 |
| 2023 | $4,275 | $60,463 | $14,194 | $46,269 |
| 2022 | $3,937 | $54,540 | $13,989 | $40,551 |
| 2021 | $3,430 | $47,416 | $13,989 | $33,427 |
| 2020 | $3,225 | $44,709 | $11,871 | $32,838 |
| 2019 | $3,275 | $45,360 | $11,871 | $33,489 |
| 2018 | $3,176 | $44,412 | $11,514 | $32,898 |
| 2017 | $3,200 | $44,339 | $11,514 | $32,825 |
| 2016 | $3,224 | $44,652 | $11,543 | $33,109 |
| 2015 | $3,278 | $45,377 | $11,543 | $33,834 |
| 2014 | $3,078 | $42,346 | $10,559 | $31,787 |
Source: Public Records
Map
Nearby Homes
- 6712 Big Sky Trail
- 2553 Wildhorse Trail
- 8012 Bobcat Rd
- 1348 Jack Ln
- 5801 Mica Bluff
- 5702 Mica Bluff
- 2544 Levi Rd
- 1336 Jessi Dr
- 1348 Jessi Dr
- 2337 Foothills Rd
- 2601 Foothills Rd
- 1314 Marie Ln
- 1236 Jessi Dr
- 1213 Alyssa Way
- 3117 Holland Ct
- 3014 Smith Place
- 5620 Blue Bluff
- 1121 Alyssa Way
- 8007 Kepler Dr
- 2340 Pattison Ave
- 2416 Sweetwater Trail
- Lot 1 Sweetwater Trail
- 2349 Wind River Trail
- 2373 Sweetwater Trail
- 2375 Wind River Trail
- 7037 Buckskin Trail
- 2384 Painted Horse Trail
- 2448 Sweetwater Trail
- 2303 Wind River Trail
- 2433 Sweetwater Trail
- 2263 Wind River Trail
- Lot 11 Sweetwater Trail
- 0 Sweetwater Trail
- 2407 Wind River Trail
- 2377 Painted Horse Trail
- 7124 Buckskin Trail
- 2324 Wind River Trail
- Lot 14 Blk 5 Painted Horse T
- 2514 Sweetwater Trail
- 2469 Wind River Trail