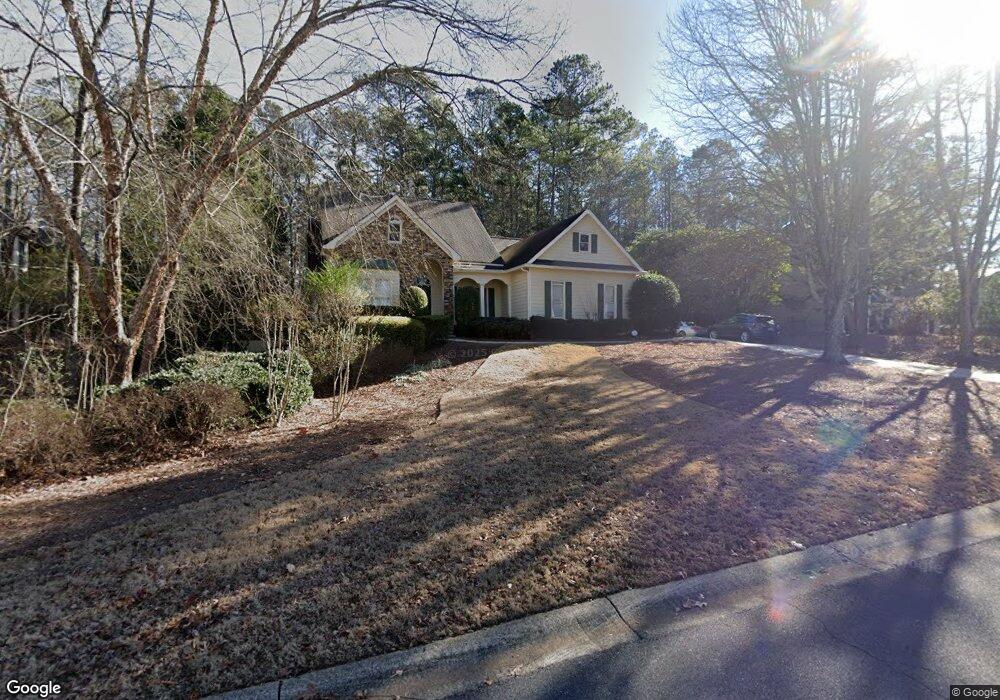
2365 Bexford View Cumming, GA 30041
Big Creek NeighborhoodEstimated Value: $546,000 - $610,000
3
Beds
3
Baths
2,077
Sq Ft
$279/Sq Ft
Est. Value
About This Home
This home is located at 2365 Bexford View, Cumming, GA 30041 and is currently estimated at $579,629, approximately $279 per square foot. 2365 Bexford View is a home located in Forsyth County with nearby schools including Daves Creek Elementary School, South Forsyth Middle School, and South Forsyth High School.
Ownership History
Date
Name
Owned For
Owner Type
Purchase Details
Closed on
Apr 30, 2002
Sold by
Kopp Kenneth M and Kopp Melanie H
Bought by
Haich Christopher J and Haich Mary C
Current Estimated Value
Home Financials for this Owner
Home Financials are based on the most recent Mortgage that was taken out on this home.
Original Mortgage
$179,900
Outstanding Balance
$77,299
Interest Rate
7.18%
Mortgage Type
New Conventional
Estimated Equity
$502,330
Purchase Details
Closed on
Oct 18, 1994
Sold by
S C G Enterprises
Bought by
Kopp Kenneth Melanie
Home Financials for this Owner
Home Financials are based on the most recent Mortgage that was taken out on this home.
Original Mortgage
$164,700
Interest Rate
8.48%
Purchase Details
Closed on
May 19, 1994
Sold by
Old Atlanta Place
Bought by
Scg Enterprises
Home Financials for this Owner
Home Financials are based on the most recent Mortgage that was taken out on this home.
Original Mortgage
$125,000
Interest Rate
8.48%
Mortgage Type
Construction
Create a Home Valuation Report for This Property
The Home Valuation Report is an in-depth analysis detailing your home's value as well as a comparison with similar homes in the area
Home Values in the Area
Average Home Value in this Area
Purchase History
| Date | Buyer | Sale Price | Title Company |
|---|---|---|---|
| Haich Christopher J | $239,900 | -- | |
| Kopp Kenneth Melanie | $183,000 | -- | |
| Scg Enterprises | $33,300 | -- |
Source: Public Records
Mortgage History
| Date | Status | Borrower | Loan Amount |
|---|---|---|---|
| Open | Haich Christopher J | $179,900 | |
| Previous Owner | Kopp Kenneth Melanie | $164,700 | |
| Previous Owner | Scg Enterprises | $125,000 |
Source: Public Records
Tax History Compared to Growth
Tax History
| Year | Tax Paid | Tax Assessment Tax Assessment Total Assessment is a certain percentage of the fair market value that is determined by local assessors to be the total taxable value of land and additions on the property. | Land | Improvement |
|---|---|---|---|---|
| 2025 | $3,917 | $222,256 | $68,000 | $154,256 |
| 2024 | $3,917 | $195,448 | $60,000 | $135,448 |
| 2023 | $3,694 | $202,360 | $60,000 | $142,360 |
| 2022 | $3,839 | $143,572 | $32,000 | $111,572 |
| 2021 | $3,484 | $143,572 | $32,000 | $111,572 |
| 2020 | $3,285 | $133,916 | $32,000 | $101,916 |
| 2019 | $3,154 | $127,340 | $32,000 | $95,340 |
| 2018 | $3,094 | $123,688 | $32,000 | $91,688 |
| 2017 | $2,790 | $108,732 | $24,000 | $84,732 |
| 2016 | $2,790 | $108,732 | $24,000 | $84,732 |
| 2015 | $2,502 | $94,852 | $24,000 | $70,852 |
| 2014 | $2,097 | $82,516 | $24,000 | $58,516 |
Source: Public Records
Map
Nearby Homes
- 2325 Melrose Trace
- 2205 Melrose Trace
- 2530 Wellsley Ln
- 1255 Bookhout Dr
- 1330 Badingham Dr
- 1065 Bookhout Dr
- 2405 Stewart Rd
- 2450 Bleckley Place
- 8920 Ellesmere Dr
- 1740 Cobble Creek Way
- 8930 Cobblestone Ln
- 3440 Canyon Oak Way
- 2405 Bleckley Place
- 1730 Vinery Ave
- 2715 Ivey Crossing Trail
- 3711 Melody Mizer Ln
- 3345 Cherry Oak Ln
- 1330 Rogers Mill Ln
- 1350 Rogers Mill Ln
- 2355 Bexford View
- 2375 Bexford View
- 2385 Bexford View
- 2360 Bexford View
- 2370 Bexford View
- 2360 Melrose Trace
- 2350 Bexford View
- 2335 Bexford View
- 2380 Bexford View
- 2350 Melrose Trace
- 2390 Bexford View
- 2235 Krystle Way
- 0 Mountclaire Dr Unit 7467008
- 0 Mountclaire Dr Unit 7293905
- 0 Mountclaire Dr Unit 7216688
- 0 Mountclaire Dr Unit 7209011
- 0 Mountclaire Dr Unit 7132211
- 0 Mountclaire Dr Unit 3252614
- 0 Mountclaire Dr Unit 8859603
- 0 Mountclaire Dr Unit 8863581