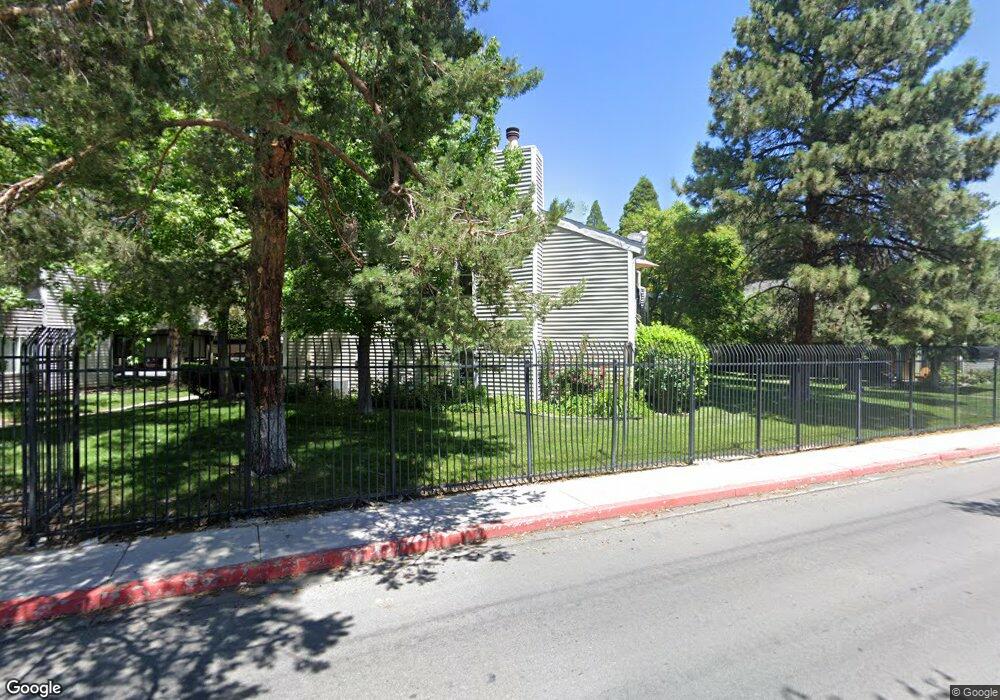
2365 Roundhouse Rd Unit P1R Sparks, NV 89431
Downtown Sparks NeighborhoodEstimated Value: $206,669 - $222,000
2
Beds
1
Bath
948
Sq Ft
$228/Sq Ft
Est. Value
About This Home
This home is located at 2365 Roundhouse Rd Unit P1R, Sparks, NV 89431 and is currently estimated at $216,417, approximately $228 per square foot. 2365 Roundhouse Rd Unit P1R is a home located in Washoe County with nearby schools including Kate M Smith Elementary School, Sparks Middle School, and Sparks High School.
Ownership History
Date
Name
Owned For
Owner Type
Purchase Details
Closed on
Jun 28, 2004
Sold by
Marble Noell
Bought by
Deknikker Susan C
Current Estimated Value
Home Financials for this Owner
Home Financials are based on the most recent Mortgage that was taken out on this home.
Original Mortgage
$62,000
Interest Rate
6.29%
Mortgage Type
Unknown
Purchase Details
Closed on
Jul 3, 2003
Sold by
Marble Noell
Bought by
Marble Noell
Home Financials for this Owner
Home Financials are based on the most recent Mortgage that was taken out on this home.
Original Mortgage
$59,500
Interest Rate
5.22%
Mortgage Type
Unknown
Purchase Details
Closed on
Feb 14, 1997
Sold by
Marble Noell and Marble Patricia
Bought by
Marble Noell and Marble Patricia
Purchase Details
Closed on
Apr 10, 1996
Sold by
Lane John and Lane Bonnie L
Bought by
Marble Noell and Marble Patricia
Purchase Details
Closed on
Sep 24, 1981
Sold by
Tezak William P and Tezak Hazel M
Bought by
Mccabe Patricia Lee
Create a Home Valuation Report for This Property
The Home Valuation Report is an in-depth analysis detailing your home's value as well as a comparison with similar homes in the area
Home Values in the Area
Average Home Value in this Area
Purchase History
| Date | Buyer | Sale Price | Title Company |
|---|---|---|---|
| Deknikker Susan C | $119,000 | Western Title Incorporated | |
| Marble Noell | -- | First Centennial Title Co | |
| Marble Noell | -- | -- | |
| Marble Noell | $54,000 | First Centennial Title Co | |
| Mccabe Patricia Lee | -- | First Centennial Title Co |
Source: Public Records
Mortgage History
| Date | Status | Borrower | Loan Amount |
|---|---|---|---|
| Previous Owner | Deknikker Susan C | $62,000 | |
| Previous Owner | Marble Noell | $59,500 | |
| Closed | Deknikker Susan C | $32,000 |
Source: Public Records
Tax History Compared to Growth
Tax History
| Year | Tax Paid | Tax Assessment Tax Assessment Total Assessment is a certain percentage of the fair market value that is determined by local assessors to be the total taxable value of land and additions on the property. | Land | Improvement |
|---|---|---|---|---|
| 2025 | $530 | $34,657 | $16,835 | $17,822 |
| 2024 | $515 | $35,647 | $16,835 | $18,812 |
| 2023 | $515 | $34,487 | $17,535 | $16,952 |
| 2022 | $501 | $27,923 | $13,160 | $14,763 |
| 2021 | $485 | $25,824 | $10,850 | $14,974 |
| 2020 | $467 | $26,196 | $10,850 | $15,346 |
| 2019 | $454 | $25,682 | $10,430 | $15,252 |
| 2018 | $441 | $20,154 | $6,055 | $14,099 |
| 2017 | $432 | $20,157 | $5,950 | $14,207 |
| 2016 | $422 | $19,289 | $4,445 | $14,844 |
| 2015 | $420 | $18,417 | $3,885 | $14,532 |
| 2014 | $408 | $12,616 | $3,080 | $9,536 |
| 2013 | -- | $10,710 | $1,960 | $8,750 |
Source: Public Records
Map
Nearby Homes
- 2363 Roundhouse Rd
- 2367 Roundhouse Rd
- 2375 Roundhouse Rd
- 2371 Roundhouse Rd
- 2361 Roundhouse Rd
- 2137 Roundhouse Rd
- 2359 Roundhouse Rd
- 2355 Roundhouse Rd
- 2373 Roundhouse Rd
- 2377 Roundhouse Rd
- 2143 Roundhouse Rd Unit 8
- 2135 Roundhouse Rd
- 2147 Roundhouse Rd
- 2139 Roundhouse Rd
- 2141 Roundhouse Rd
- 2347 Roundhouse Rd
- 2133 Roundhouse Rd
- 2351 Roundhouse Rd
- 2383 Roundhouse Rd
- 2379 Roundhouse Rd