Estimated Value: $402,000 - $412,000
4
Beds
2
Baths
1,457
Sq Ft
$279/Sq Ft
Est. Value
About This Home
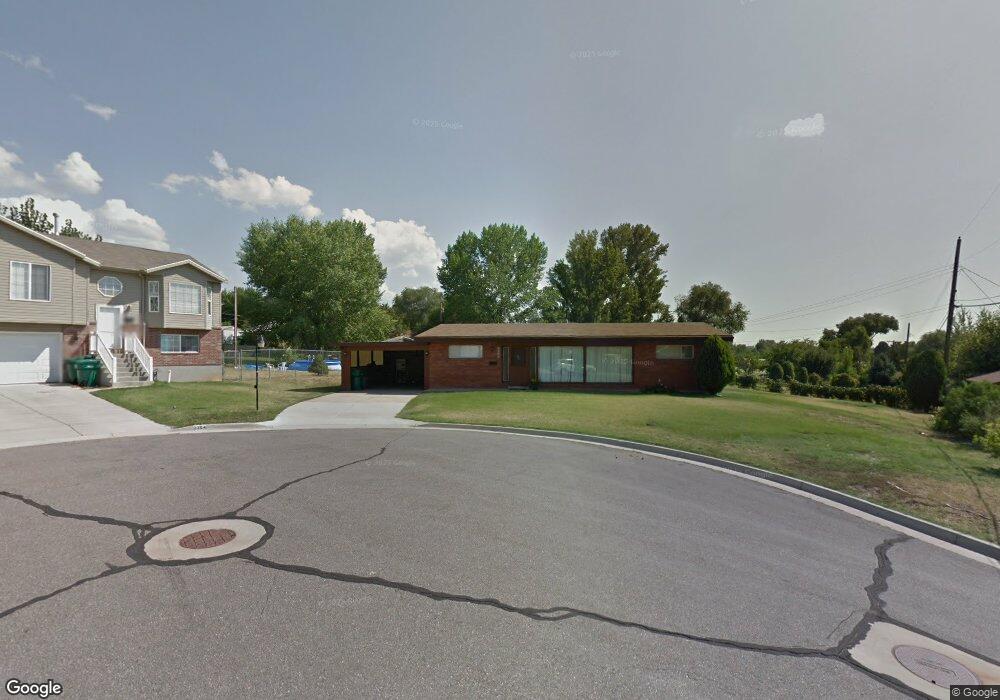
This home is located at 2365 W 5400 S, Roy, UT 84067 and is currently estimated at $406,730, approximately $279 per square foot. 2365 W 5400 S is a home located in Weber County with nearby schools including Lakeview Elementary School, Roy Junior High School, and Roy High School.
Ownership History
Date
Name
Owned For
Owner Type
Purchase Details
Closed on
Mar 25, 2022
Sold by
Thornock Casey D
Bought by
Richison Nancy and Richison Gary
Current Estimated Value
Purchase Details
Closed on
Apr 25, 2013
Sold by
Brenchley Kevin and Brenchley Lori
Bought by
Thornock Casey D
Home Financials for this Owner
Home Financials are based on the most recent Mortgage that was taken out on this home.
Original Mortgage
$127,546
Interest Rate
3.25%
Mortgage Type
FHA
Create a Home Valuation Report for This Property
The Home Valuation Report is an in-depth analysis detailing your home's value as well as a comparison with similar homes in the area
Home Values in the Area
Average Home Value in this Area
Purchase History
| Date | Buyer | Sale Price | Title Company |
|---|---|---|---|
| Richison Nancy | -- | Stewart Title | |
| Thornock Casey D | -- | Inwest Title Ogden |
Source: Public Records
Mortgage History
| Date | Status | Borrower | Loan Amount |
|---|---|---|---|
| Previous Owner | Thornock Casey D | $127,546 |
Source: Public Records
Tax History Compared to Growth
Tax History
| Year | Tax Paid | Tax Assessment Tax Assessment Total Assessment is a certain percentage of the fair market value that is determined by local assessors to be the total taxable value of land and additions on the property. | Land | Improvement |
|---|---|---|---|---|
| 2025 | $2,474 | $388,422 | $125,091 | $263,331 |
| 2024 | $2,415 | $210,099 | $68,800 | $141,299 |
| 2023 | $2,313 | $201,300 | $65,252 | $136,048 |
| 2022 | $2,144 | $190,300 | $56,405 | $133,895 |
| 2021 | $1,763 | $256,000 | $72,234 | $183,766 |
| 2020 | $1,683 | $225,000 | $72,234 | $152,766 |
| 2019 | $1,615 | $203,000 | $41,914 | $161,086 |
| 2018 | $1,460 | $171,000 | $36,755 | $134,245 |
| 2017 | $1,411 | $155,000 | $36,755 | $118,245 |
| 2016 | $1,288 | $75,314 | $16,859 | $58,455 |
| 2015 | $1,145 | $67,729 | $16,859 | $50,870 |
| 2014 | $1,154 | $67,729 | $16,859 | $50,870 |
Source: Public Records
Map
Nearby Homes
- 5345 S 2425 W
- 5333 S 2200 W
- 5289 S 2200 W
- 2184 W 5500 S
- 5261 S 2200 W
- 5326 S 2675 W
- 5243 S 2200 W
- 5643 S 2200 W
- 5545 S 2100 W Unit 12
- 5545 S 2100 W Unit 20
- 5545 S 2100 W Unit D22
- 2146 W 5600 S Unit 29
- 5140 S 2175 W
- 2266 W 5100 S
- 5317 S 2690 W
- 5185 S 2100 W
- 2646 W 5625 S Unit M-2646
- 5140 S 2100 W
- 2571 W 5725 S
- 5024 S 2575 W