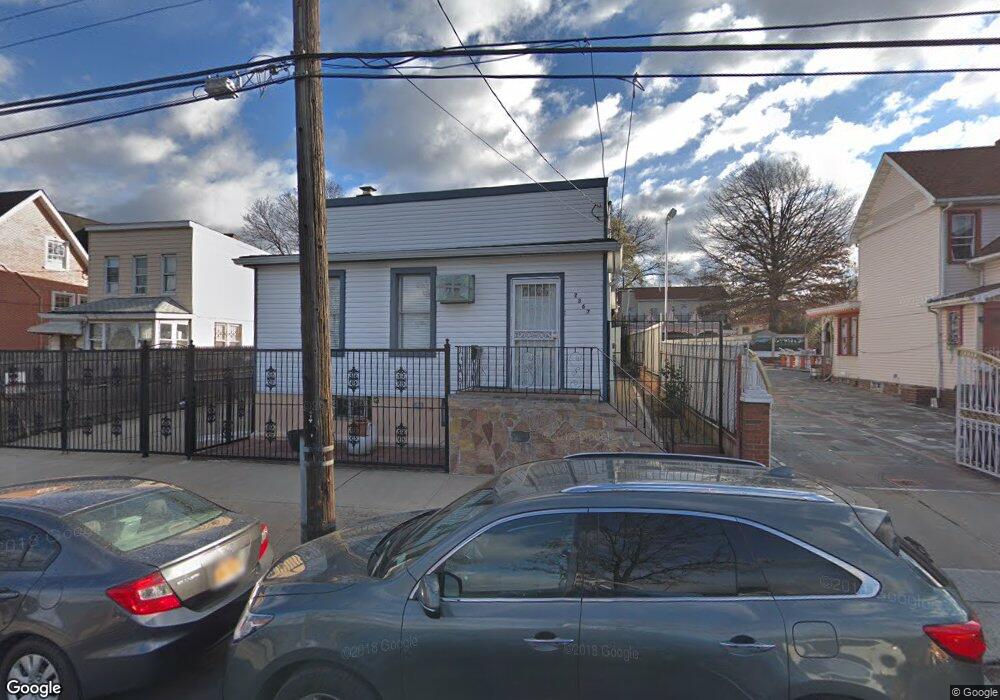
2367 89th St East Elmhurst, NY 11369
Jackson Heights NeighborhoodEstimated Value: $1,010,000 - $1,158,000
3
Beds
2
Baths
2,208
Sq Ft
$485/Sq Ft
Est. Value
About This Home
This home is located at 2367 89th St, East Elmhurst, NY 11369 and is currently estimated at $1,071,056, approximately $485 per square foot. 2367 89th St is a home located in Queens County with nearby schools including P.S. 127 Aerospace Science Magnet School, I.S. 145 Joseph Pulitzer Magnet School, and William Cullen Bryant High School.
Ownership History
Date
Name
Owned For
Owner Type
Purchase Details
Closed on
Sep 16, 2022
Sold by
Paz Alvaro and Paz Ruby
Bought by
Cachay Manuela
Current Estimated Value
Home Financials for this Owner
Home Financials are based on the most recent Mortgage that was taken out on this home.
Original Mortgage
$639,000
Outstanding Balance
$610,342
Interest Rate
5.22%
Mortgage Type
Purchase Money Mortgage
Estimated Equity
$460,714
Create a Home Valuation Report for This Property
The Home Valuation Report is an in-depth analysis detailing your home's value as well as a comparison with similar homes in the area
Home Values in the Area
Average Home Value in this Area
Purchase History
| Date | Buyer | Sale Price | Title Company |
|---|---|---|---|
| Cachay Manuela | $1,065,000 | -- |
Source: Public Records
Mortgage History
| Date | Status | Borrower | Loan Amount |
|---|---|---|---|
| Open | Cachay Manuela | $639,000 |
Source: Public Records
Tax History Compared to Growth
Tax History
| Year | Tax Paid | Tax Assessment Tax Assessment Total Assessment is a certain percentage of the fair market value that is determined by local assessors to be the total taxable value of land and additions on the property. | Land | Improvement |
|---|---|---|---|---|
| 2025 | $4,576 | $24,112 | $4,246 | $19,866 |
| 2024 | $4,576 | $22,784 | $4,365 | $18,419 |
| 2023 | $4,576 | $22,784 | $3,686 | $19,098 |
| 2022 | $1,372 | $65,220 | $11,220 | $54,000 |
| 2021 | $1,580 | $69,780 | $11,220 | $58,560 |
| 2020 | $1,467 | $64,200 | $11,220 | $52,980 |
| 2019 | $1,327 | $62,160 | $11,220 | $50,940 |
| 2018 | $1,276 | $18,987 | $4,635 | $14,352 |
| 2017 | $1,180 | $17,914 | $4,608 | $13,306 |
| 2016 | $1,151 | $17,914 | $4,608 | $13,306 |
| 2015 | $580 | $16,744 | $5,691 | $11,053 |
| 2014 | $580 | $15,823 | $5,647 | $10,176 |
Source: Public Records
Map
Nearby Homes