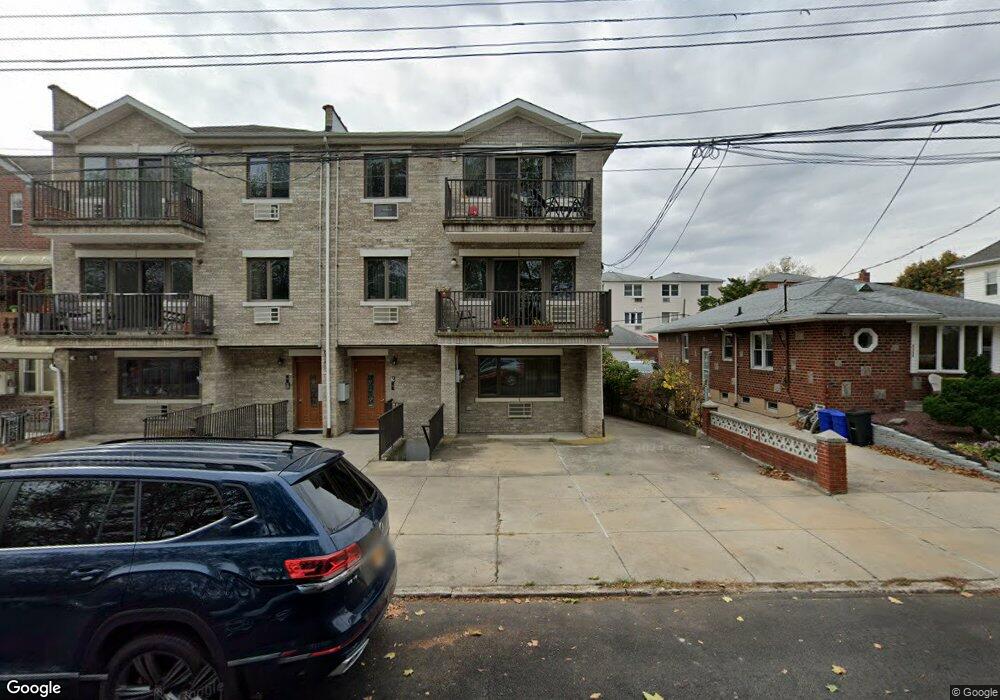
2368 Burnett St Unit 1B Brooklyn, NY 11229
Marine Park NeighborhoodEstimated Value: $533,000 - $787,000
--
Bed
--
Bath
1,559
Sq Ft
$435/Sq Ft
Est. Value
About This Home
This home is located at 2368 Burnett St Unit 1B, Brooklyn, NY 11229 and is currently estimated at $678,162, approximately $434 per square foot. 2368 Burnett St Unit 1B is a home located in Kings County with nearby schools including P.S. 277 Gerritsen Beach, J.H.S. 278 Marine Park, and New Visions Charter High School for Advanced Math/ Science.
Ownership History
Date
Name
Owned For
Owner Type
Purchase Details
Closed on
Feb 9, 2021
Sold by
Svirskaia Elena and Svirskaya Elena
Bought by
Anna Svirskaya As Trustee and Oleg Svirsky, As Trustee
Current Estimated Value
Purchase Details
Closed on
Apr 11, 2001
Sold by
Burnett Street Llc
Bought by
Gourevitch Mikhail and Svirskaia Elena
Home Financials for this Owner
Home Financials are based on the most recent Mortgage that was taken out on this home.
Original Mortgage
$150,000
Interest Rate
6.9%
Purchase Details
Closed on
Jan 6, 1999
Sold by
Rago Judith
Bought by
Korchmar Gregory and Jabour Joseph
Home Financials for this Owner
Home Financials are based on the most recent Mortgage that was taken out on this home.
Original Mortgage
$258,750
Interest Rate
7.73%
Mortgage Type
Purchase Money Mortgage
Create a Home Valuation Report for This Property
The Home Valuation Report is an in-depth analysis detailing your home's value as well as a comparison with similar homes in the area
Home Values in the Area
Average Home Value in this Area
Purchase History
| Date | Buyer | Sale Price | Title Company |
|---|---|---|---|
| Anna Svirskaya As Trustee | -- | -- | |
| Gourevitch Mikhail | -- | -- | |
| Korchmar Gregory | $345,000 | Titlecrafters Inc |
Source: Public Records
Mortgage History
| Date | Status | Borrower | Loan Amount |
|---|---|---|---|
| Previous Owner | Gourevitch Mikhail | $150,000 | |
| Previous Owner | Korchmar Gregory | $258,750 |
Source: Public Records
Tax History Compared to Growth
Tax History
| Year | Tax Paid | Tax Assessment Tax Assessment Total Assessment is a certain percentage of the fair market value that is determined by local assessors to be the total taxable value of land and additions on the property. | Land | Improvement |
|---|---|---|---|---|
| 2025 | $2,845 | $56,084 | $1,255 | $54,829 |
| 2024 | $2,845 | $44,336 | $1,255 | $43,081 |
| 2023 | $5,681 | $39,203 | $1,255 | $37,948 |
| 2022 | $5,245 | $36,159 | $1,255 | $34,904 |
| 2021 | $5,206 | $33,026 | $1,255 | $31,771 |
| 2020 | $1,294 | $33,095 | $1,255 | $31,840 |
| 2019 | $5,135 | $31,991 | $1,255 | $30,736 |
| 2018 | $4,692 | $24,477 | $879 | $23,598 |
| 2017 | $4,408 | $23,092 | $895 | $22,197 |
| 2016 | $3,634 | $21,787 | $880 | $20,907 |
| 2015 | $510 | $21,787 | $1,075 | $20,712 |
| 2014 | $510 | $21,621 | $1,074 | $20,547 |
Source: Public Records
Map
Nearby Homes
- 2348 Burnett St
- 2373 Stuart St
- 2312 Stuart St Unit 2L
- 2251 Plumb 1st St Unit 6H
- 2251 Plumb 1st St Unit 5G
- 2251 Plumb 1st St Unit 6B
- 2251 Plumb 1st St Unit 1H
- 2241 Plumb 1st St Unit 6N
- 2241 Plumb 1st St Unit 3N
- 2241 Plumb 1st St Unit 5S
- 2212 Plumb 1st St Unit 1-C
- 2209 Knapp St Unit 6H
- 2209 Knapp St Unit 5A
- 2209 Knapp St Unit 3G
- 3171 Whitney Ave Unit 1B
- 3171 Whitney Ave Unit 3F
- 2265 Gerritsen Ave Unit 3S
- 2265 Gerritsen Ave Unit 5C
- 2265 Gerritsen Ave Unit 4-D
- 2265 Gerritsen Ave Unit 4G
- 2368 Burnett St Unit 3B
- 2368 Burnett St Unit 2B
- 2372 Burnett St Unit 3A
- 2372 Burnett St Unit 2A
- 2372 Burnett St Unit 1A
- 2368 Burnett St
- 2374 Burnett St
- 2364 Burnett St
- 2369 Stuart St
- 2367 Stuart St
- 3227 Whitney Ave
- 2356 Burnett St
- 2359 Stuart St
- 3231 Whitney Ave
- 2375 Stuart St
- 3223 Whitney Ave
- 2357 Stuart St
- 2377 Stuart St
- 2352 Burnett St
- 2381 Stuart St