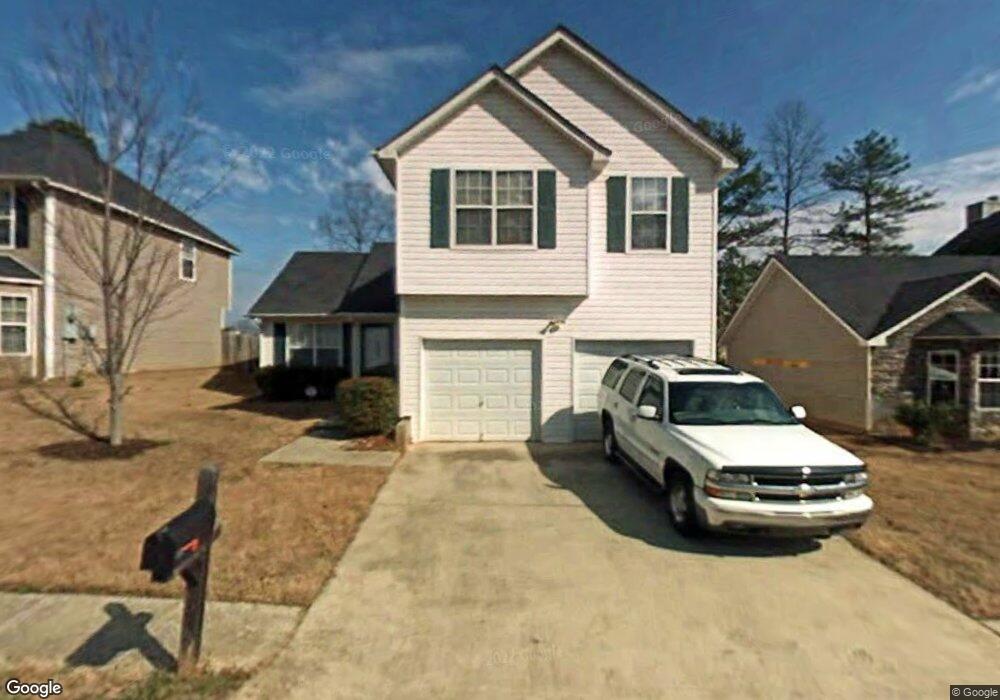
2368 Rambling Way Lithonia, GA 30058
Estimated Value: $240,705 - $280,000
3
Beds
3
Baths
1,687
Sq Ft
$151/Sq Ft
Est. Value
About This Home
This home is located at 2368 Rambling Way, Lithonia, GA 30058 and is currently estimated at $254,676, approximately $150 per square foot. 2368 Rambling Way is a home located in DeKalb County with nearby schools including Stoneview Elementary School, Lithonia Middle School, and Lithonia High School.
Ownership History
Date
Name
Owned For
Owner Type
Purchase Details
Closed on
Apr 18, 2018
Sold by
2015B Property Owner Llc
Bought by
Tah 2018 1 Borrower Llc and C/O Tricon American Homes Llc
Current Estimated Value
Purchase Details
Closed on
Apr 1, 2015
Sold by
American Home Real Estate Part
Bought by
2015B Property Owner Llc
Purchase Details
Closed on
Jul 3, 2012
Sold by
Abdul Qadeera
Bought by
The American Home Real Estate
Purchase Details
Closed on
May 6, 2008
Sold by
Wells Fargo Bk Na
Bought by
Hud-Housing Of Urban Dev
Purchase Details
Closed on
Oct 19, 2000
Sold by
Global Residential Inc
Bought by
Abdul Qadeera
Home Financials for this Owner
Home Financials are based on the most recent Mortgage that was taken out on this home.
Original Mortgage
$114,883
Interest Rate
7.91%
Mortgage Type
New Conventional
Create a Home Valuation Report for This Property
The Home Valuation Report is an in-depth analysis detailing your home's value as well as a comparison with similar homes in the area
Home Values in the Area
Average Home Value in this Area
Purchase History
| Date | Buyer | Sale Price | Title Company |
|---|---|---|---|
| Tah 2018 1 Borrower Llc | -- | -- | |
| 2015B Property Owner Llc | $10,965,274 | -- | |
| The American Home Real Estate | -- | -- | |
| Hud-Housing Of Urban Dev | -- | -- | |
| Newby Tabatha | $183,164 | -- | |
| Abdul Qadeera | $116,400 | -- |
Source: Public Records
Mortgage History
| Date | Status | Borrower | Loan Amount |
|---|---|---|---|
| Previous Owner | Abdul Qadeera | $114,883 |
Source: Public Records
Tax History Compared to Growth
Tax History
| Year | Tax Paid | Tax Assessment Tax Assessment Total Assessment is a certain percentage of the fair market value that is determined by local assessors to be the total taxable value of land and additions on the property. | Land | Improvement |
|---|---|---|---|---|
| 2025 | $4,652 | $94,560 | $17,021 | $77,539 |
| 2024 | $4,845 | $99,600 | $18,000 | $81,600 |
| 2023 | $4,845 | $60,560 | $7,873 | $52,687 |
| 2022 | $2,975 | $60,560 | $7,873 | $52,687 |
| 2021 | $3,016 | $60,560 | $8,000 | $52,560 |
| 2020 | $2,653 | $52,960 | $8,000 | $44,960 |
| 2019 | $2,351 | $46,440 | $8,000 | $38,440 |
| 2018 | $1,822 | $45,320 | $8,000 | $37,320 |
| 2017 | $2,269 | $44,360 | $4,200 | $40,160 |
| 2016 | $2,059 | $39,520 | $4,200 | $35,320 |
| 2014 | $1,353 | $22,960 | $4,133 | $18,827 |
Source: Public Records
Map
Nearby Homes
- 6565 Shaffers Way
- 6317 Creekford Ln
- 2338 Rambling Way
- 6300 Creekford Ln
- 6372 Stonebridge Creek Ln
- 2315 Rambling Way
- 6384 Stonebridge Creek Ln
- 6301 Creekford Dr
- 2281 Rambling Way
- 6394 Kennonbriar Ct
- 6396 Kennonbriar Ct
- 2520 Rambling Way
- 2590 Wellington Walk Place
- 6410 Kennonbriar Ct
- 6348 Wellington Walk Way
- 6344 Wellington Walk Way
- 6318 Wellington Walk Way
- 6255 Creekford Ln Unit 4
- 6347 Wellington Walk Way
- 6460 Wellington Chase Ct
- 2362 Rambling Way Unit 1
- 6557 Shaffers Way
- 6561 Shaffers Way
- 2380 Rambling Way
- 6317 Stonebridge Creek Ln
- 2367 Rambling Way
- 2373 Rambling Way Unit 1
- 2361 Rambling Way
- 2386 Rambling Way
- 2379 Rambling Way
- 6306 Stonebridge Creek Ln Unit 1
- 6312 Stonebridge Creek Ln
- 6569 Shaffers Way
- 2388 Rambling Way
- 0 Shaffers Way Unit 8672213
- 0 Shaffers Way Unit 3201850
- 0 Shaffers Way Unit 7565884
- 0 Shaffers Way
- 6318 Stonebridge Creek Ln
- 2385 Rambling Way