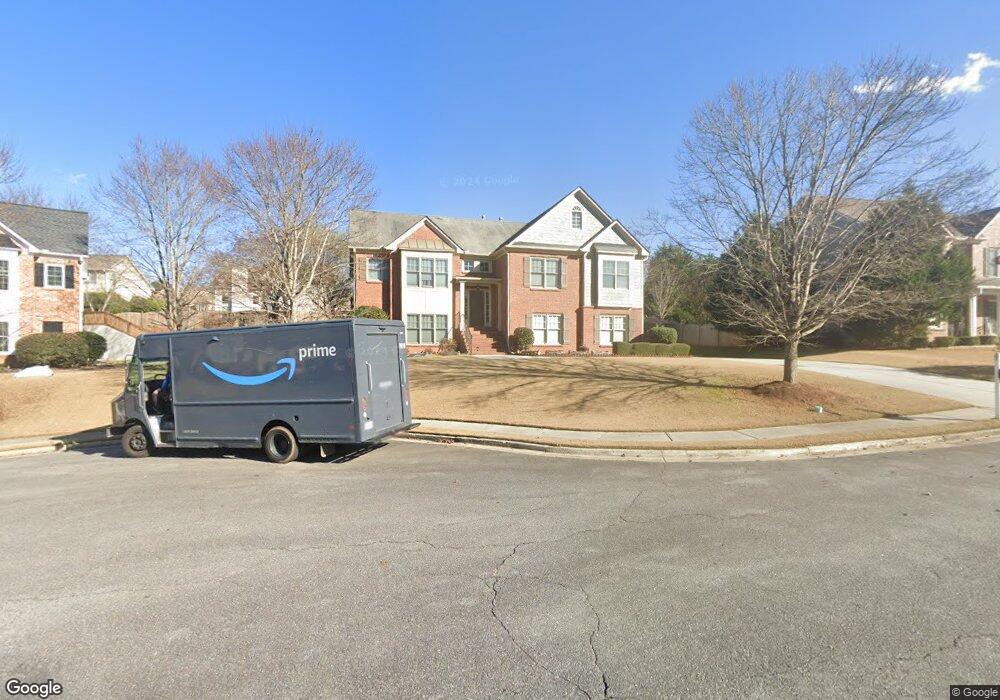
2368 Stone Willow Way Buford, GA 30519
Estimated Value: $506,000 - $559,000
4
Beds
3
Baths
2,804
Sq Ft
$191/Sq Ft
Est. Value
About This Home
This home is located at 2368 Stone Willow Way, Buford, GA 30519 and is currently estimated at $535,825, approximately $191 per square foot. 2368 Stone Willow Way is a home located in Gwinnett County with nearby schools including Patrick Elementary School and Glenn C. Jones Middle School.
Ownership History
Date
Name
Owned For
Owner Type
Purchase Details
Closed on
Apr 26, 2022
Sold by
Sinclair Joan
Bought by
Gutt Jose
Current Estimated Value
Home Financials for this Owner
Home Financials are based on the most recent Mortgage that was taken out on this home.
Original Mortgage
$449,350
Outstanding Balance
$424,572
Interest Rate
4.67%
Mortgage Type
New Conventional
Estimated Equity
$111,253
Purchase Details
Closed on
Dec 13, 2014
Sold by
Sinclair Michael M
Bought by
Sinclair Joan
Home Financials for this Owner
Home Financials are based on the most recent Mortgage that was taken out on this home.
Original Mortgage
$154,000
Interest Rate
4.03%
Mortgage Type
New Conventional
Purchase Details
Closed on
Dec 1, 2005
Sold by
Touchstone Homes Inc
Bought by
Sinclair Michael M and Sinclair Joan
Home Financials for this Owner
Home Financials are based on the most recent Mortgage that was taken out on this home.
Original Mortgage
$193,204
Interest Rate
6.23%
Mortgage Type
New Conventional
Create a Home Valuation Report for This Property
The Home Valuation Report is an in-depth analysis detailing your home's value as well as a comparison with similar homes in the area
Home Values in the Area
Average Home Value in this Area
Purchase History
| Date | Buyer | Sale Price | Title Company |
|---|---|---|---|
| Gutt Jose | $480,000 | -- | |
| Sinclair Joan | -- | -- | |
| Sinclair Michael M | $241,600 | -- |
Source: Public Records
Mortgage History
| Date | Status | Borrower | Loan Amount |
|---|---|---|---|
| Open | Gutt Jose | $449,350 | |
| Previous Owner | Sinclair Joan | $154,000 | |
| Previous Owner | Sinclair Michael M | $193,204 |
Source: Public Records
Tax History Compared to Growth
Tax History
| Year | Tax Paid | Tax Assessment Tax Assessment Total Assessment is a certain percentage of the fair market value that is determined by local assessors to be the total taxable value of land and additions on the property. | Land | Improvement |
|---|---|---|---|---|
| 2024 | $7,014 | $216,640 | $34,000 | $182,640 |
| 2023 | $7,014 | $192,000 | $34,000 | $158,000 |
| 2022 | $5,034 | $158,440 | $29,200 | $129,240 |
| 2021 | $4,249 | $117,720 | $22,800 | $94,920 |
| 2020 | $4,275 | $117,720 | $22,800 | $94,920 |
| 2019 | $4,131 | $117,720 | $22,800 | $94,920 |
| 2018 | $3,800 | $104,240 | $20,000 | $84,240 |
| 2016 | $3,324 | $90,080 | $18,000 | $72,080 |
| 2015 | $3,120 | $83,400 | $16,000 | $67,400 |
| 2014 | $3,136 | $83,400 | $16,000 | $67,400 |
Source: Public Records
Map
Nearby Homes
- 2330 Chandler Grove Dr
- 2692 Bogan Creek Dr
- 2361 Black Bear Ct Unit 2
- 2550 Kilgore Rd
- 2551 Kilgore Rd
- 3568 Foxworth Ct
- 3665 Mystic Dr Unit 2
- 2452 Kilgore Rd
- 3685 Rolling Creek Dr
- 2372 Wood Beil Ct
- 2753 Blue Moon Dr Unit 4
- 2395 Kilgore Rd
- The Aspen A Plan at Fern Hollow
- The Hickory F Plan at Fern Hollow
- The Danbury J Plan at Fern Hollow
- 4041 Lost Mill Ln
- 3600 Devenwood Way
- 2183 Ivy Crest Dr
- 2710 Kilgore Rd
- 2718 Kilgore Rd
- 2378 Stone Willow Way
- 2358 Stone Willow Way
- 2400 Chandler Grove Dr
- 2400 Chandler Grove Dr
- 2410 Chandler Grove Dr Unit GA0012
- 2410 Chandler Grove Dr
- 2410 Chandler Grove Dr
- 2410 Chandler Grove Dr Unit GA00124
- 2390 Chandler Grove Dr
- 2388 Stone Willow Way
- 2348 Stone Willow Way
- 2365 Stone Willow Way
- 2355 Stone Willow Way
- 2420 Chandler Grove Dr
- 2380 Chandler Grove Dr
- 2345 Stone Willow Way
- 2375 Stone Willow Way
- 0 Stone Willow Way Unit 8687732
- 0 Stone Willow Way Unit 8450809
- 0 Stone Willow Way Unit 7422380