Estimated Value: $364,000 - $400,000
2
Beds
2
Baths
912
Sq Ft
$422/Sq Ft
Est. Value
About This Home
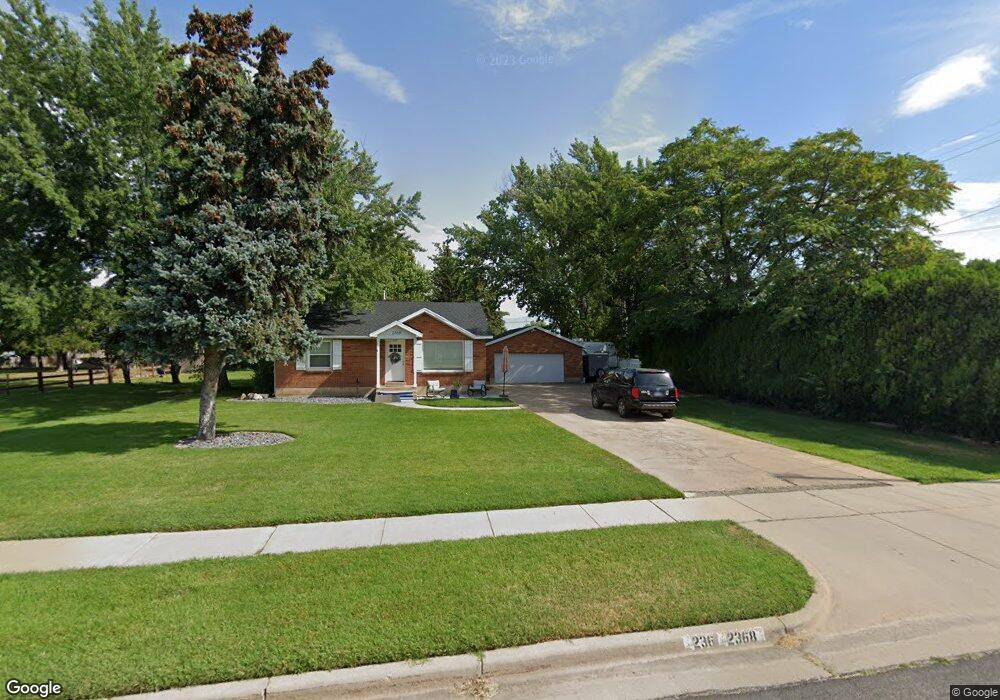
This home is located at 2368 W 4400 S, Roy, UT 84067 and is currently estimated at $385,310, approximately $422 per square foot. 2368 W 4400 S is a home located in Weber County with nearby schools including Valley View School, Sand Ridge Junior High School, and Roy High School.
Ownership History
Date
Name
Owned For
Owner Type
Purchase Details
Closed on
Dec 13, 2019
Sold by
Craven Kyron and Sorenson Megan J
Bought by
Craven Kyron and Craven Meagan J
Current Estimated Value
Purchase Details
Closed on
May 12, 2017
Sold by
Child Wendell P
Bought by
Craven Kyron and Sorension Megan J
Home Financials for this Owner
Home Financials are based on the most recent Mortgage that was taken out on this home.
Original Mortgage
$167,902
Outstanding Balance
$138,270
Interest Rate
3.75%
Mortgage Type
FHA
Estimated Equity
$247,040
Purchase Details
Closed on
Jun 15, 1999
Sold by
Child Earl B and Child Janice P
Bought by
Child Earl B and Child Janice P
Purchase Details
Closed on
May 7, 1999
Sold by
Child Earl B and Child Janice P
Bought by
Child Earl B and Child Janice P
Create a Home Valuation Report for This Property
The Home Valuation Report is an in-depth analysis detailing your home's value as well as a comparison with similar homes in the area
Home Values in the Area
Average Home Value in this Area
Purchase History
| Date | Buyer | Sale Price | Title Company |
|---|---|---|---|
| Craven Kyron | -- | Wasatch Title Ins Agcy Llc | |
| Craven Kyron | -- | Mountain View Title | |
| Child Earl B | -- | -- | |
| Child Earl B | -- | -- | |
| Child Earl B | -- | -- |
Source: Public Records
Mortgage History
| Date | Status | Borrower | Loan Amount |
|---|---|---|---|
| Open | Craven Kyron | $167,902 |
Source: Public Records
Tax History Compared to Growth
Tax History
| Year | Tax Paid | Tax Assessment Tax Assessment Total Assessment is a certain percentage of the fair market value that is determined by local assessors to be the total taxable value of land and additions on the property. | Land | Improvement |
|---|---|---|---|---|
| 2025 | $2,394 | $370,720 | $135,482 | $235,238 |
| 2024 | $2,341 | $200,748 | $74,524 | $126,224 |
| 2023 | $2,260 | $194,150 | $66,275 | $127,875 |
| 2022 | $2,316 | $205,150 | $56,140 | $149,010 |
| 2021 | $1,893 | $273,999 | $73,133 | $200,866 |
| 2020 | $1,801 | $240,000 | $73,133 | $166,867 |
| 2019 | $1,710 | $214,000 | $44,516 | $169,484 |
| 2018 | $1,607 | $189,001 | $41,653 | $147,348 |
| 2017 | $1,392 | $151,000 | $41,653 | $109,347 |
| 2016 | $1,255 | $72,399 | $18,443 | $53,956 |
| 2015 | $1,210 | $71,718 | $18,443 | $53,275 |
| 2014 | $1,218 | $71,718 | $18,443 | $53,275 |
Source: Public Records
Map
Nearby Homes