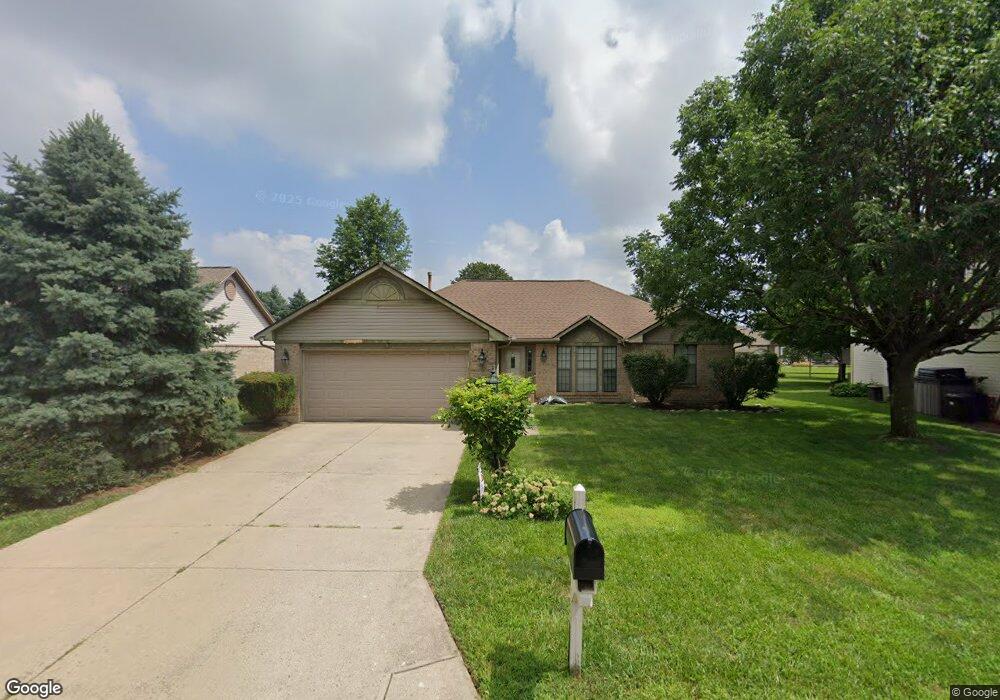
2369 Bugleboy Ct Miamisburg, OH 45342
Estimated Value: $302,000 - $324,000
3
Beds
2
Baths
1,481
Sq Ft
$211/Sq Ft
Est. Value
About This Home
This home is located at 2369 Bugleboy Ct, Miamisburg, OH 45342 and is currently estimated at $312,918, approximately $211 per square foot. 2369 Bugleboy Ct is a home located in Montgomery County with nearby schools including Miamisburg High School, Bishop Leibold School, and Dayton Christian School.
Ownership History
Date
Name
Owned For
Owner Type
Purchase Details
Closed on
Dec 7, 2020
Sold by
Hamilton Angela J and Hamilton Angela Joy
Bought by
Bockman Lacey and Pina Delilah
Current Estimated Value
Home Financials for this Owner
Home Financials are based on the most recent Mortgage that was taken out on this home.
Original Mortgage
$219,945
Interest Rate
2.6%
Mortgage Type
VA
Purchase Details
Closed on
Nov 23, 2020
Sold by
Hamilton Timothy N and Hamilton Angela S
Bought by
Hamilton Angela Joy
Home Financials for this Owner
Home Financials are based on the most recent Mortgage that was taken out on this home.
Original Mortgage
$219,945
Interest Rate
2.6%
Mortgage Type
VA
Purchase Details
Closed on
Aug 31, 2020
Sold by
Hamilton Timothy N and Hamilton Angela J
Bought by
Hamilton Angela Joy
Home Financials for this Owner
Home Financials are based on the most recent Mortgage that was taken out on this home.
Original Mortgage
$145,000
Interest Rate
2.71%
Mortgage Type
New Conventional
Purchase Details
Closed on
Oct 15, 2014
Sold by
Mcclain Marlana S
Bought by
Hamilton Timothy N and Hamilton Angela J
Home Financials for this Owner
Home Financials are based on the most recent Mortgage that was taken out on this home.
Original Mortgage
$156,021
Interest Rate
4.13%
Mortgage Type
FHA
Purchase Details
Closed on
Mar 15, 2011
Sold by
Nianouris Christopher D and Nianouris Heather B
Bought by
Mcclain Marlana S
Home Financials for this Owner
Home Financials are based on the most recent Mortgage that was taken out on this home.
Original Mortgage
$116,800
Interest Rate
5.09%
Mortgage Type
New Conventional
Purchase Details
Closed on
Dec 22, 2005
Sold by
Nianouris David Paul and Nianouris Susan L
Bought by
Nianouris Christopher D
Home Financials for this Owner
Home Financials are based on the most recent Mortgage that was taken out on this home.
Original Mortgage
$144,400
Interest Rate
6.4%
Mortgage Type
Fannie Mae Freddie Mac
Purchase Details
Closed on
Sep 6, 2005
Sold by
Wall James L
Bought by
Nianouris David Paul
Purchase Details
Closed on
Sep 18, 2003
Sold by
Credit Ricky L And Marcia J
Bought by
Wall James L
Purchase Details
Closed on
Mar 9, 1998
Sold by
Lama Amy L
Bought by
Credit Ricky L and Credit Marcia J
Home Financials for this Owner
Home Financials are based on the most recent Mortgage that was taken out on this home.
Original Mortgage
$108,715
Interest Rate
7.14%
Mortgage Type
Stand Alone First
Purchase Details
Closed on
Nov 26, 1996
Sold by
Hutsell Robert E and Hutsell Cheryl L M
Bought by
Lama Amy L
Create a Home Valuation Report for This Property
The Home Valuation Report is an in-depth analysis detailing your home's value as well as a comparison with similar homes in the area
Home Values in the Area
Average Home Value in this Area
Purchase History
| Date | Buyer | Sale Price | Title Company |
|---|---|---|---|
| Bockman Lacey | $215,000 | Chicago Title Company Llc | |
| Hamilton Angela Joy | -- | Accommodation | |
| Hamilton Angela Joy | -- | Mortgage Connect Lp | |
| Hamilton Timothy N | $158,900 | Aspen Title Agency | |
| Mcclain Marlana S | $146,000 | None Available | |
| Nianouris Christopher D | $152,000 | Midwest Title Company | |
| Nianouris David Paul | $152,000 | Chicago Title Insurance Co | |
| Wall James L | $145,000 | -- | |
| Credit Ricky L | $127,900 | First Service Title Agency I | |
| Credit Ricky L | $127,900 | -- | |
| Lama Amy L | $125,000 | -- |
Source: Public Records
Mortgage History
| Date | Status | Borrower | Loan Amount |
|---|---|---|---|
| Previous Owner | Bockman Lacey | $219,945 | |
| Previous Owner | Hamilton Angela Joy | $145,000 | |
| Previous Owner | Hamilton Timothy N | $156,021 | |
| Previous Owner | Mcclain Marlana S | $116,800 | |
| Previous Owner | Nianouris Christopher D | $144,400 | |
| Previous Owner | Credit Ricky L | $108,715 |
Source: Public Records
Tax History Compared to Growth
Tax History
| Year | Tax Paid | Tax Assessment Tax Assessment Total Assessment is a certain percentage of the fair market value that is determined by local assessors to be the total taxable value of land and additions on the property. | Land | Improvement |
|---|---|---|---|---|
| 2024 | $5,868 | $84,190 | $17,010 | $67,180 |
| 2023 | $5,868 | $84,190 | $17,010 | $67,180 |
| 2022 | $5,188 | $62,360 | $12,600 | $49,760 |
| 2021 | $4,832 | $62,360 | $12,600 | $49,760 |
| 2020 | $4,789 | $62,360 | $12,600 | $49,760 |
| 2019 | $4,481 | $52,870 | $10,500 | $42,370 |
| 2018 | $4,450 | $52,870 | $10,500 | $42,370 |
| 2017 | $4,423 | $52,870 | $10,500 | $42,370 |
| 2016 | $3,886 | $44,460 | $10,500 | $33,960 |
| 2015 | $3,820 | $44,460 | $10,500 | $33,960 |
| 2014 | $3,820 | $44,460 | $10,500 | $33,960 |
| 2012 | -- | $52,220 | $13,300 | $38,920 |
Source: Public Records
Map
Nearby Homes
- 2115 Autumn Haze Trail
- 2378 Ferndown Dr
- 9528 Summer Wind Trail
- 9406 Tahoe Dr Unit 19406
- 9604 Tahoe Dr
- 9588 Tahoe Dr
- 1794 Placid Dr
- 9540 Tahoe Dr
- 9553 Tahoe Dr
- 9515 Tahoe Dr
- 9519 Tahoe Dr
- 9607 Olde Georgetown
- 1963 Waterstone Blvd Unit 104
- 9251 Great Lakes Cir Unit 59251
- 1875 Waterstone Blvd Unit 312
- 9747 Cobblewood Ct
- 9616 Wild Ginger Way
- 1591 Watermark Ct Unit 241591
- 2968 Asbury Ct
- 1739 Waterstone Blvd Unit 208
- 2365 Bugleboy Ct
- 2312 Windsong Ct
- 2361 Bugleboy Ct
- 2306 Windsong Ct
- 2381 Bugleboy Ct
- 2368 Bugleboy Ct
- 2370 Promenade Way
- 9301 Heritage Glen Dr
- 9317 Heritage Glen Dr
- 2374 Bugleboy Ct
- 2320 Windsong Ct
- 9291 Heritage Glen Dr
- 2379 Promenade Way
- 2387 Bugleboy Ct
- 2360 Promenade Way
- 2386 Bugleboy Ct
- 2380 Bugleboy Ct
- 9281 Heritage Glen Dr
- 9314 Heritage Glen Dr
- 2321 Clarion Ct