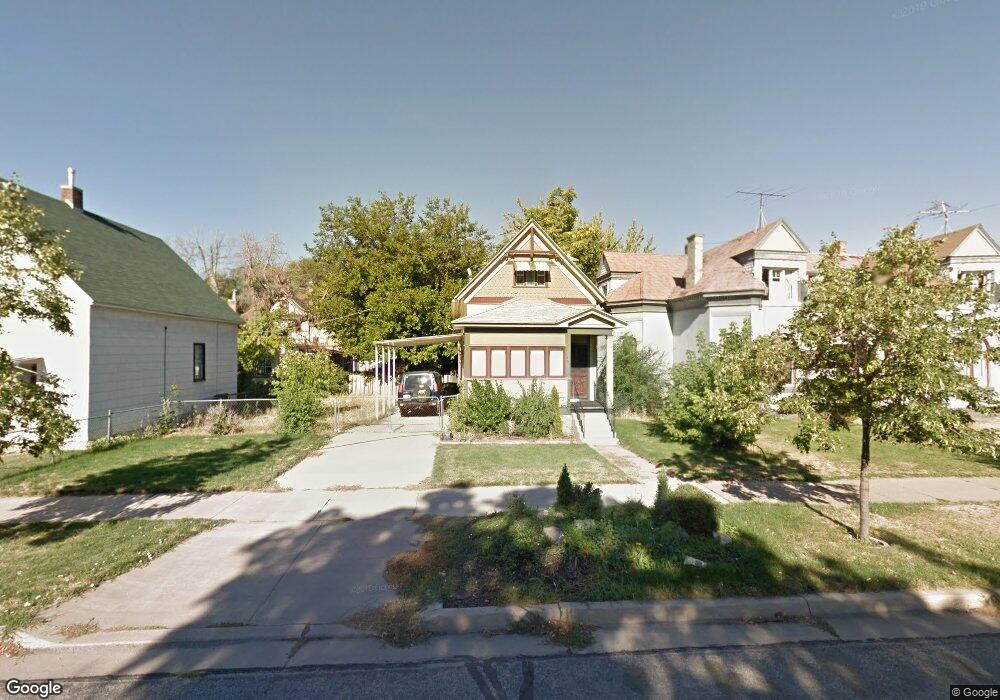
2369 Jefferson Ave Ogden, UT 84401
East Central Ogden NeighborhoodEstimated Value: $294,544 - $320,000
2
Beds
1
Bath
1,161
Sq Ft
$267/Sq Ft
Est. Value
About This Home
This home is located at 2369 Jefferson Ave, Ogden, UT 84401 and is currently estimated at $310,136, approximately $267 per square foot. 2369 Jefferson Ave is a home located in Weber County with nearby schools including New Bridge School, Mound Fort Junior High School, and Ogden High School.
Ownership History
Date
Name
Owned For
Owner Type
Purchase Details
Closed on
Aug 15, 2007
Sold by
Cook Brandon and Cook Petra
Bought by
Cook Brandon and Cook Petra
Current Estimated Value
Purchase Details
Closed on
Jan 31, 2007
Sold by
Cook Brandon D
Bought by
Cook Brandon and Cook Petra
Home Financials for this Owner
Home Financials are based on the most recent Mortgage that was taken out on this home.
Original Mortgage
$84,000
Outstanding Balance
$50,172
Interest Rate
6.11%
Mortgage Type
New Conventional
Estimated Equity
$259,964
Purchase Details
Closed on
Sep 10, 1998
Sold by
Cook Laura L
Bought by
Cook Brandon D
Home Financials for this Owner
Home Financials are based on the most recent Mortgage that was taken out on this home.
Original Mortgage
$82,450
Interest Rate
8.99%
Purchase Details
Closed on
Jan 8, 1996
Sold by
Sorenson Jeffrey P
Bought by
Cook Brandon D and Cook Laura L
Home Financials for this Owner
Home Financials are based on the most recent Mortgage that was taken out on this home.
Original Mortgage
$54,800
Interest Rate
7.18%
Create a Home Valuation Report for This Property
The Home Valuation Report is an in-depth analysis detailing your home's value as well as a comparison with similar homes in the area
Home Values in the Area
Average Home Value in this Area
Purchase History
| Date | Buyer | Sale Price | Title Company |
|---|---|---|---|
| Cook Brandon | -- | Backman | |
| Cook Brandon | -- | Backman | |
| Cook Brandon D | -- | First American Title | |
| Cook Brandon D | -- | Bonneville Title |
Source: Public Records
Mortgage History
| Date | Status | Borrower | Loan Amount |
|---|---|---|---|
| Open | Cook Brandon | $84,000 | |
| Closed | Cook Brandon D | $82,450 | |
| Previous Owner | Cook Brandon D | $54,800 | |
| Closed | Cook Brandon D | $6,850 |
Source: Public Records
Tax History Compared to Growth
Tax History
| Year | Tax Paid | Tax Assessment Tax Assessment Total Assessment is a certain percentage of the fair market value that is determined by local assessors to be the total taxable value of land and additions on the property. | Land | Improvement |
|---|---|---|---|---|
| 2025 | $1,898 | $278,266 | $91,477 | $186,789 |
| 2024 | $1,952 | $154,549 | $50,312 | $104,237 |
| 2023 | $1,808 | $144,100 | $46,379 | $97,721 |
| 2022 | $2,045 | $163,350 | $43,788 | $119,562 |
| 2021 | $1,682 | $223,000 | $40,357 | $182,643 |
| 2020 | $1,347 | $165,000 | $31,214 | $133,786 |
| 2019 | $1,261 | $145,000 | $26,311 | $118,689 |
| 2018 | $1,015 | $116,000 | $21,284 | $94,716 |
| 2017 | $899 | $96,000 | $29,401 | $66,599 |
| 2016 | $701 | $40,453 | $10,217 | $30,236 |
| 2015 | $700 | $39,421 | $10,217 | $29,204 |
| 2014 | $698 | $38,570 | $9,731 | $28,839 |
Source: Public Records
Map
Nearby Homes
- 536 E 2360 S
- 2370 S Madison Ave
- 658 23rd St Unit 1
- 739 24th St
- 2218 Adams Ave
- 1371 E Cahoon Dr S
- 2255 Ogden Ave
- 2209 Adams Ave
- 477 E 22nd St
- 2560 Porter Ave
- 471 E 22nd St
- 486 26th St
- 823 23rd St
- 866 Cahoon Cir
- 2527 Gramercy Ave
- 2236 Gramercy Ave
- 840 E 22nd St
- 551 27th St
- 2664 Liberty Ave
- 949 24th St
- 2377 Jefferson Ave
- 2361 Jefferson Ave
- 584 24th St Unit C
- 584 24th St Unit B
- 584 24th St Unit A
- 584 24th St
- 570 24th St
- 2355 Jefferson Ave
- 2351 Jefferson Ave
- 600 24th St
- 550 24th St
- 554 E 2390 S
- 2341 Jefferson Ave
- 2352 Jefferson Ave
- 2364 Jefferson Ave Unit 1
- 2364 Jefferson Ave
- 2364 Jefferson Ave
- 548 24th St Unit 22
- 614 24th St
- 2348 Jefferson Ave Unit 4