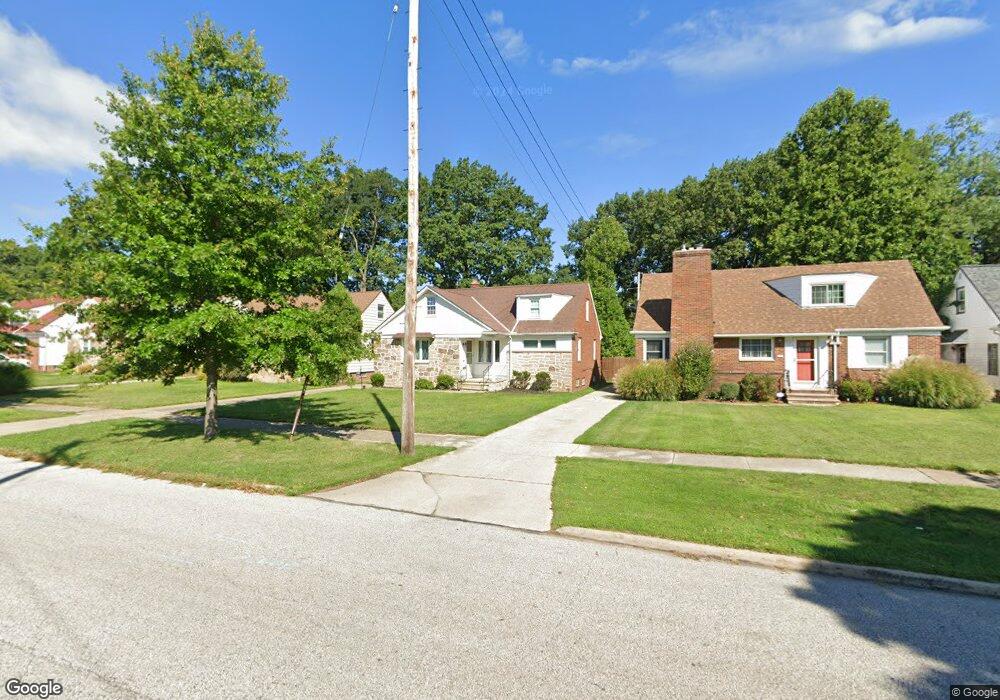
23691 Glenbrook Blvd Euclid, OH 44117
Estimated Value: $193,000 - $238,000
4
Beds
1
Bath
1,710
Sq Ft
$121/Sq Ft
Est. Value
About This Home
This home is located at 23691 Glenbrook Blvd, Euclid, OH 44117 and is currently estimated at $206,185, approximately $120 per square foot. 23691 Glenbrook Blvd is a home located in Cuyahoga County with nearby schools including Thomas Jefferson Elementary School, Euclid Middle School, and Euclid High School.
Ownership History
Date
Name
Owned For
Owner Type
Purchase Details
Closed on
Feb 9, 2002
Sold by
Eppich William A and Eppich Nancy R
Bought by
Kraft Chris J and Kraft Kathleen O
Current Estimated Value
Home Financials for this Owner
Home Financials are based on the most recent Mortgage that was taken out on this home.
Original Mortgage
$107,920
Outstanding Balance
$45,191
Interest Rate
7.24%
Estimated Equity
$160,994
Purchase Details
Closed on
Jul 28, 1998
Sold by
Marko Mary T Trs
Bought by
Eppich William A and Eppich Nancy R
Home Financials for this Owner
Home Financials are based on the most recent Mortgage that was taken out on this home.
Original Mortgage
$60,000
Interest Rate
7.03%
Purchase Details
Closed on
Nov 8, 1979
Sold by
Johnston Bruce A and Johnston Clarion E
Bought by
Marko Mary T
Purchase Details
Closed on
Jan 1, 1975
Bought by
Johnston Bruce A and Johnston Clarion E
Create a Home Valuation Report for This Property
The Home Valuation Report is an in-depth analysis detailing your home's value as well as a comparison with similar homes in the area
Home Values in the Area
Average Home Value in this Area
Purchase History
| Date | Buyer | Sale Price | Title Company |
|---|---|---|---|
| Kraft Chris J | $134,900 | -- | |
| Eppich William A | $110,000 | Rockwell Title Agency Inc | |
| Marko Mary T | $72,000 | -- | |
| Johnston Bruce A | -- | -- |
Source: Public Records
Mortgage History
| Date | Status | Borrower | Loan Amount |
|---|---|---|---|
| Open | Kraft Chris J | $107,920 | |
| Closed | Eppich William A | $60,000 | |
| Closed | Kraft Chris J | $20,235 |
Source: Public Records
Tax History Compared to Growth
Tax History
| Year | Tax Paid | Tax Assessment Tax Assessment Total Assessment is a certain percentage of the fair market value that is determined by local assessors to be the total taxable value of land and additions on the property. | Land | Improvement |
|---|---|---|---|---|
| 2024 | $3,594 | $62,090 | $10,640 | $51,450 |
| 2023 | $3,035 | $44,170 | $8,330 | $35,840 |
| 2022 | $3,000 | $44,170 | $8,330 | $35,840 |
| 2021 | $3,339 | $44,170 | $8,330 | $35,840 |
| 2020 | $3,050 | $38,080 | $7,180 | $30,910 |
| 2019 | $2,744 | $108,800 | $20,500 | $88,300 |
| 2018 | $2,770 | $38,080 | $7,180 | $30,910 |
| 2017 | $2,858 | $34,020 | $5,740 | $28,280 |
| 2016 | $2,864 | $34,020 | $5,740 | $28,280 |
| 2015 | $2,607 | $34,020 | $5,740 | $28,280 |
| 2014 | $2,607 | $34,020 | $5,740 | $28,280 |
Source: Public Records
Map
Nearby Homes
- 23751 Glenbrook Blvd
- 1696 E 236th St
- 23795 Greenwood Rd
- 1765 E 238th St
- 1775 E 228th St
- 1774 E 236th St
- 24105 Chardon Rd
- 2093 Newcome St
- 1620 E 243rd St
- 21950 Euclid Ave
- 1554 E 221st St
- 22261 Chardon Rd
- 2075 E 226th St
- 24720 Dundee Dr
- 1851 Beverly Hills Dr
- 1865 Idlehurst Dr
- 1545 E 214th St
- 2111 Aberdeen Dr
- 363 Balmoral Dr
- 24691 Hawthorne Dr
- 23651 Glenbrook Blvd
- 23701 Glenbrook Blvd
- 23601 Glenbrook Blvd
- 23591 Glenbrook Blvd
- 23791 Glenbrook Blvd
- 23650 Effingham Blvd
- 23600 Effingham Blvd
- 23590 Effingham Blvd
- 23690 Effingham Blvd
- 23551 Glenbrook Blvd
- 23750 Effingham Blvd
- 23550 Effingham Blvd
- 23801 Glenbrook Blvd
- 23790 Effingham Blvd
- 23700 Glenbrook Blvd
- 23600 Glenbrook Blvd
- 23650 Glenbrook Blvd
- 23750 Glenbrook Blvd
- 23501 Glenbrook Blvd
- 23851 Glenbrook Blvd