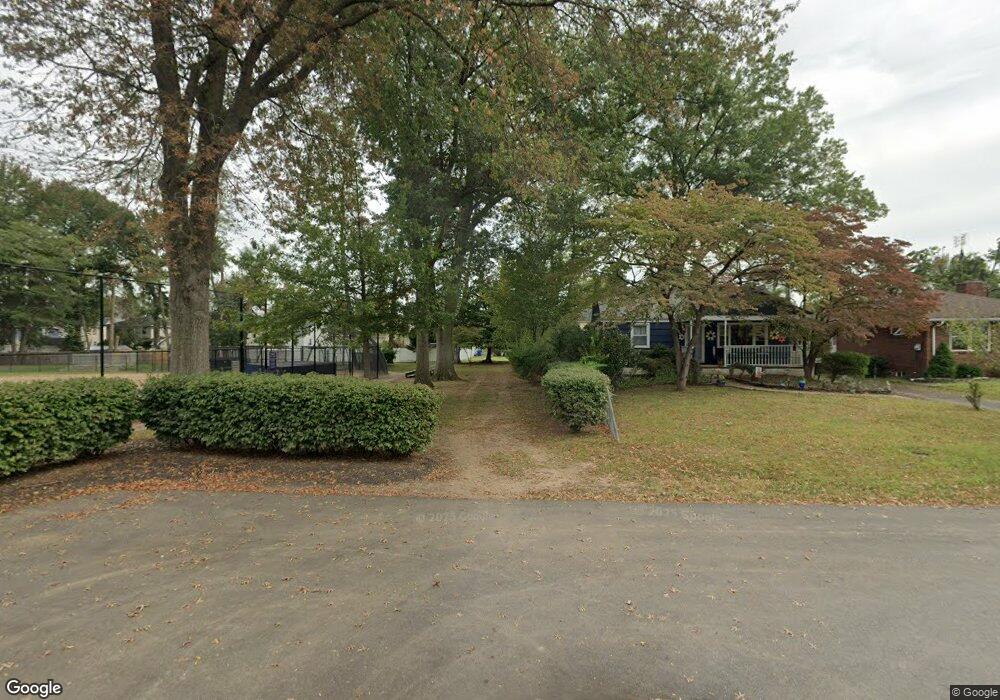
237 4th St Dunellen, NJ 08812
Estimated Value: $450,000 - $492,000
3
Beds
2
Baths
1,020
Sq Ft
$459/Sq Ft
Est. Value
About This Home
This home is located at 237 4th St, Dunellen, NJ 08812 and is currently estimated at $467,906, approximately $458 per square foot. 237 4th St is a home located in Middlesex County with nearby schools including John P. Faber Elementary School, Lincoln Middle School, and Dunellen High School.
Ownership History
Date
Name
Owned For
Owner Type
Purchase Details
Closed on
Aug 11, 2006
Sold by
Colanduoni Donald
Bought by
Petcos Kimberly
Current Estimated Value
Home Financials for this Owner
Home Financials are based on the most recent Mortgage that was taken out on this home.
Original Mortgage
$230,000
Outstanding Balance
$138,388
Interest Rate
6.8%
Estimated Equity
$329,518
Purchase Details
Closed on
Mar 15, 2000
Sold by
Silber Ronald
Bought by
Mehta Family Llc
Home Financials for this Owner
Home Financials are based on the most recent Mortgage that was taken out on this home.
Original Mortgage
$1,100,000
Interest Rate
8.31%
Create a Home Valuation Report for This Property
The Home Valuation Report is an in-depth analysis detailing your home's value as well as a comparison with similar homes in the area
Home Values in the Area
Average Home Value in this Area
Purchase History
| Date | Buyer | Sale Price | Title Company |
|---|---|---|---|
| Petcos Kimberly | $320,000 | -- | |
| Mehta Family Llc | $550,000 | -- |
Source: Public Records
Mortgage History
| Date | Status | Borrower | Loan Amount |
|---|---|---|---|
| Open | Petcos Kimberly | $230,000 | |
| Previous Owner | Mehta Family Llc | $1,100,000 |
Source: Public Records
Tax History
| Year | Tax Paid | Tax Assessment Tax Assessment Total Assessment is a certain percentage of the fair market value that is determined by local assessors to be the total taxable value of land and additions on the property. | Land | Improvement |
|---|---|---|---|---|
| 2025 | $9,112 | $377,500 | $96,100 | $281,400 |
| 2024 | $9,240 | $363,300 | $96,100 | $267,200 |
Source: Public Records
Map
Nearby Homes
Your Personal Tour Guide
Ask me questions while you tour the home.