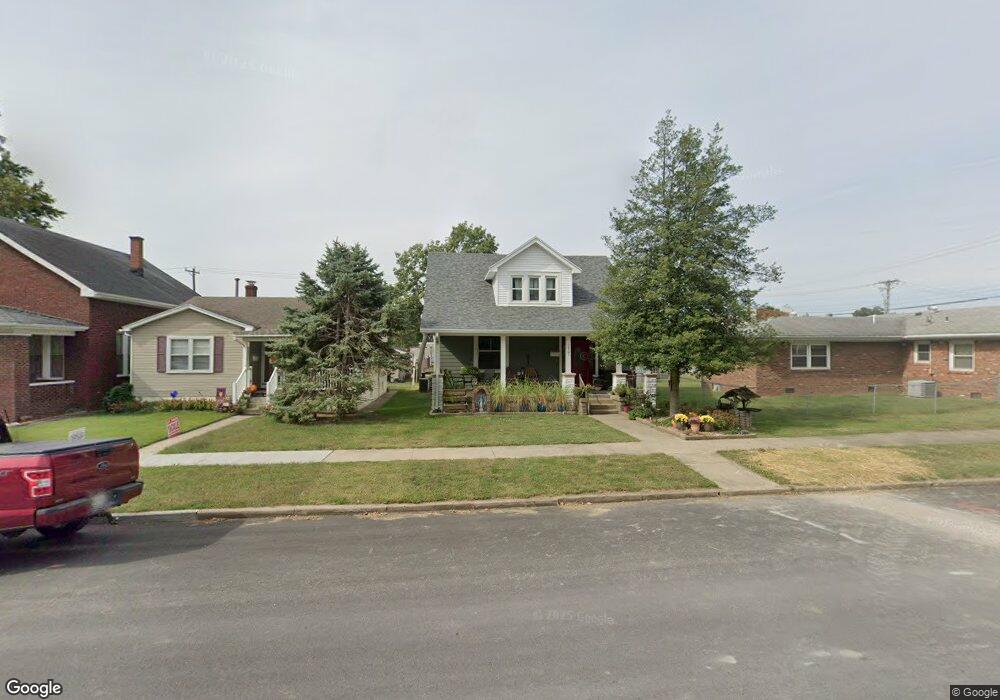
237 9th St Tell City, IN 47586
Estimated Value: $131,000 - $186,000
4
Beds
2
Baths
2,726
Sq Ft
$60/Sq Ft
Est. Value
About This Home
This home is located at 237 9th St, Tell City, IN 47586 and is currently estimated at $162,393, approximately $59 per square foot. 237 9th St is a home located in Perry County with nearby schools including William Tell Elementary School, Tell City Junior/Senior High School, and Agape Christian Academy.
Ownership History
Date
Name
Owned For
Owner Type
Purchase Details
Closed on
May 14, 2021
Sold by
Alvey Rentals Llc
Bought by
Alvey Chris E and Alvey Carol
Current Estimated Value
Home Financials for this Owner
Home Financials are based on the most recent Mortgage that was taken out on this home.
Original Mortgage
$63,500
Outstanding Balance
$57,547
Interest Rate
3.1%
Mortgage Type
New Conventional
Estimated Equity
$104,846
Purchase Details
Closed on
Nov 27, 2014
Sold by
Alvey Terrill Alan and Goffinet Ramona Lee
Bought by
Alvey Rentals Llc
Create a Home Valuation Report for This Property
The Home Valuation Report is an in-depth analysis detailing your home's value as well as a comparison with similar homes in the area
Home Values in the Area
Average Home Value in this Area
Purchase History
| Date | Buyer | Sale Price | Title Company |
|---|---|---|---|
| Alvey Chris E | -- | None Available | |
| Alvey Rentals Llc | -- | None Available |
Source: Public Records
Mortgage History
| Date | Status | Borrower | Loan Amount |
|---|---|---|---|
| Open | Alvey Chris E | $63,500 |
Source: Public Records
Tax History Compared to Growth
Tax History
| Year | Tax Paid | Tax Assessment Tax Assessment Total Assessment is a certain percentage of the fair market value that is determined by local assessors to be the total taxable value of land and additions on the property. | Land | Improvement |
|---|---|---|---|---|
| 2024 | $1,098 | $109,800 | $9,200 | $100,600 |
| 2023 | $1,924 | $106,000 | $9,200 | $96,800 |
| 2022 | $885 | $102,500 | $9,200 | $93,300 |
| 2021 | $914 | $97,300 | $9,200 | $88,100 |
| 2020 | $1,892 | $91,600 | $9,200 | $82,400 |
| 2019 | $1,688 | $81,400 | $8,900 | $72,500 |
| 2018 | $1,696 | $81,600 | $8,800 | $72,800 |
| 2017 | $1,651 | $79,300 | $8,800 | $70,500 |
| 2016 | $1,651 | $79,300 | $8,800 | $70,500 |
| 2014 | $1,626 | $78,300 | $8,800 | $69,500 |
| 2013 | $1,626 | $80,700 | $8,800 | $71,900 |
Source: Public Records
Map
Nearby Homes