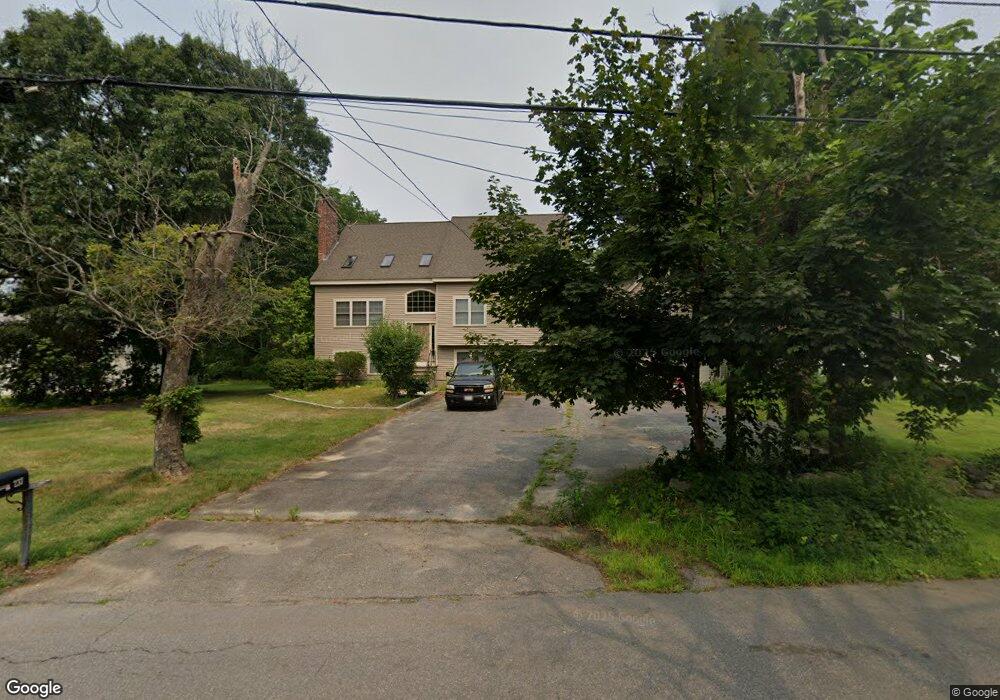
237 Berlin Rd Marlborough, MA 01752
French Hill NeighborhoodEstimated Value: $617,000 - $926,000
3
Beds
4
Baths
2,241
Sq Ft
$358/Sq Ft
Est. Value
About This Home
This home is located at 237 Berlin Rd, Marlborough, MA 01752 and is currently estimated at $801,321, approximately $357 per square foot. 237 Berlin Rd is a home located in Middlesex County with nearby schools including Marlborough High School, New Covenant Christian School, and Hillside School.
Ownership History
Date
Name
Owned For
Owner Type
Purchase Details
Closed on
Mar 31, 2000
Sold by
Spury David P
Bought by
Schwab Ronald F and Schwab Brenda M
Current Estimated Value
Home Financials for this Owner
Home Financials are based on the most recent Mortgage that was taken out on this home.
Original Mortgage
$220,000
Interest Rate
8.4%
Mortgage Type
Purchase Money Mortgage
Purchase Details
Closed on
Sep 15, 1988
Sold by
Gustafson Ronald W
Bought by
Spury David P
Create a Home Valuation Report for This Property
The Home Valuation Report is an in-depth analysis detailing your home's value as well as a comparison with similar homes in the area
Home Values in the Area
Average Home Value in this Area
Purchase History
| Date | Buyer | Sale Price | Title Company |
|---|---|---|---|
| Schwab Ronald F | $275,000 | -- | |
| Spury David P | $190,000 | -- |
Source: Public Records
Mortgage History
| Date | Status | Borrower | Loan Amount |
|---|---|---|---|
| Open | Spury David P | $218,600 | |
| Closed | Spury David P | $220,000 | |
| Previous Owner | Spury David P | $15,000 |
Source: Public Records
Tax History
| Year | Tax Paid | Tax Assessment Tax Assessment Total Assessment is a certain percentage of the fair market value that is determined by local assessors to be the total taxable value of land and additions on the property. | Land | Improvement |
|---|---|---|---|---|
| 2025 | $8,401 | $852,000 | $232,900 | $619,100 |
| 2024 | $8,144 | $795,300 | $211,700 | $583,600 |
| 2023 | $7,711 | $668,200 | $183,100 | $485,100 |
| 2022 | $7,286 | $555,300 | $174,400 | $380,900 |
| 2021 | $7,422 | $537,800 | $145,400 | $392,400 |
| 2020 | $7,220 | $509,200 | $132,800 | $376,400 |
| 2019 | $6,343 | $450,800 | $135,600 | $315,200 |
| 2018 | $6,282 | $429,400 | $119,800 | $309,600 |
| 2017 | $6,526 | $426,000 | $120,700 | $305,300 |
| 2016 | $6,590 | $429,600 | $120,700 | $308,900 |
| 2015 | $6,564 | $416,500 | $124,900 | $291,600 |
Source: Public Records
Map
Nearby Homes
- 369 Berlin Rd
- 287 Elm St
- 0 Pleasant St
- 207 Bigelow St
- 638 Pleasant St
- 53 Hunter Ave
- 34 Brigham Ave
- 745 Pleasant St
- 25 Avebury Ln Unit 22
- 154 Pleasant St
- 30 Franklin St
- 0 Dudley St
- 198 Chestnut St
- 1 Elm St
- 17 Trailside Terrace Unit 17
- 511 Bigelow St
- 30 Winter Ave
- 76 Broad St
- 37 Gibbon St
- 45 Lakeside Ave Unit 31
Your Personal Tour Guide
Ask me questions while you tour the home.