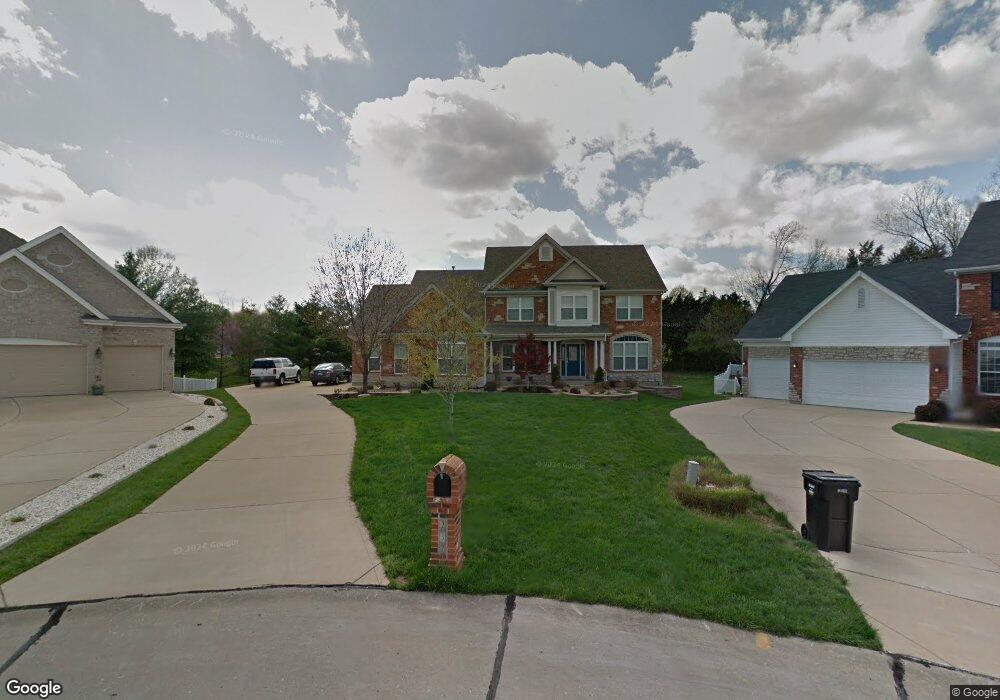
237 Bluff View Cir Saint Louis, MO 63129
Estimated Value: $667,505 - $834,000
5
Beds
5
Baths
3,999
Sq Ft
$192/Sq Ft
Est. Value
About This Home
This home is located at 237 Bluff View Cir, Saint Louis, MO 63129 and is currently estimated at $767,876, approximately $192 per square foot. 237 Bluff View Cir is a home located in St. Louis County with nearby schools including Point Elementary School, Oakville Middle School, and Oakville Senior High School.
Ownership History
Date
Name
Owned For
Owner Type
Purchase Details
Closed on
Apr 6, 2022
Sold by
Hantman Stephen L
Bought by
Nolan Marc and Nolan Leah
Current Estimated Value
Home Financials for this Owner
Home Financials are based on the most recent Mortgage that was taken out on this home.
Original Mortgage
$546,250
Outstanding Balance
$511,117
Interest Rate
3.89%
Mortgage Type
New Conventional
Estimated Equity
$256,759
Purchase Details
Closed on
Aug 2, 2001
Sold by
Smith Michael J and Smith Carolyn M
Bought by
Hantman Stephen L and Hantman Barbara J
Home Financials for this Owner
Home Financials are based on the most recent Mortgage that was taken out on this home.
Original Mortgage
$300,000
Interest Rate
7.12%
Purchase Details
Closed on
May 24, 2001
Sold by
The Jones Company Custom Homes Inc
Bought by
Smith Michael J and Smith Carolyn M
Home Financials for this Owner
Home Financials are based on the most recent Mortgage that was taken out on this home.
Original Mortgage
$205,000
Interest Rate
7.01%
Create a Home Valuation Report for This Property
The Home Valuation Report is an in-depth analysis detailing your home's value as well as a comparison with similar homes in the area
Home Values in the Area
Average Home Value in this Area
Purchase History
| Date | Buyer | Sale Price | Title Company |
|---|---|---|---|
| Nolan Marc | -- | True Title | |
| Hantman Stephen L | $438,000 | -- | |
| Smith Michael J | $422,710 | -- | |
| Smith Michael J | -- | -- |
Source: Public Records
Mortgage History
| Date | Status | Borrower | Loan Amount |
|---|---|---|---|
| Open | Nolan Marc | $546,250 | |
| Previous Owner | Hantman Stephen L | $300,000 | |
| Previous Owner | Smith Michael J | $205,000 |
Source: Public Records
Tax History
| Year | Tax Paid | Tax Assessment Tax Assessment Total Assessment is a certain percentage of the fair market value that is determined by local assessors to be the total taxable value of land and additions on the property. | Land | Improvement |
|---|---|---|---|---|
| 2025 | $7,108 | $119,490 | $21,890 | $97,600 |
| 2024 | $7,108 | $106,190 | $14,250 | $91,940 |
| 2023 | $7,017 | $106,190 | $14,250 | $91,940 |
| 2022 | $6,280 | $95,500 | $12,030 | $83,470 |
| 2021 | $6,076 | $95,500 | $12,030 | $83,470 |
| 2020 | $6,071 | $90,760 | $11,550 | $79,210 |
| 2019 | $6,053 | $90,760 | $11,550 | $79,210 |
| 2018 | $6,694 | $90,670 | $10,340 | $80,330 |
| 2016 | $6,333 | $82,410 | $10,340 | $72,070 |
Source: Public Records
Map
Nearby Homes
- 6324 Telegraph Rd
- 155 Susan Rd
- 2835 Belle Terre Ct
- 6129 Arbor Green Dr
- 6116 Arbor Green Dr
- 2655 Storm Lake Dr
- 169 Tori Pines Dr Unit 35
- 173 Tori Pines Dr Unit 37
- 2804 Bear Creek Ct
- 6533 Heintz Rd
- 6835 Bear Creek Dr
- 7008 Willow Stream Ct
- 5810 Flaming Leaf Ct
- 2948 Erb Rd
- 2111 Chatport Rd
- 6906 Wellsford Ct
- 5709 Chatport Rd
- 5788 Westphalia Ln Unit 5788
- 5766 Westphalia Ln Unit B
- 6808 Cottage Grove Ln Unit I
- 233 Bluff View Cir
- 241 Bluff View Cir
- 201 Grimsley Station Bluff Dr
- 6445 Bluff Farm Dr
- 229 Bluff View Cir
- 245 Bluff View Cir
- 132 Staehle Ct
- 203 Grimsley Station Bluff Dr
- 225 Bluff View Cir
- 249 Bluff View Cir
- 128 Staehle Ct
- 6453 Bluff Farm Dr
- 228 Bluff View Cir
- 248 Bluff View Cir
- 207 Grimsley Station Bluff Dr
- 133 Staehle Ct
- 6457 Bluff Farm Dr
- 221 Bluff View Cir
- 202 Grimsley Station Bluff Dr
- 253 Bluff View Cir
Your Personal Tour Guide
Ask me questions while you tour the home.