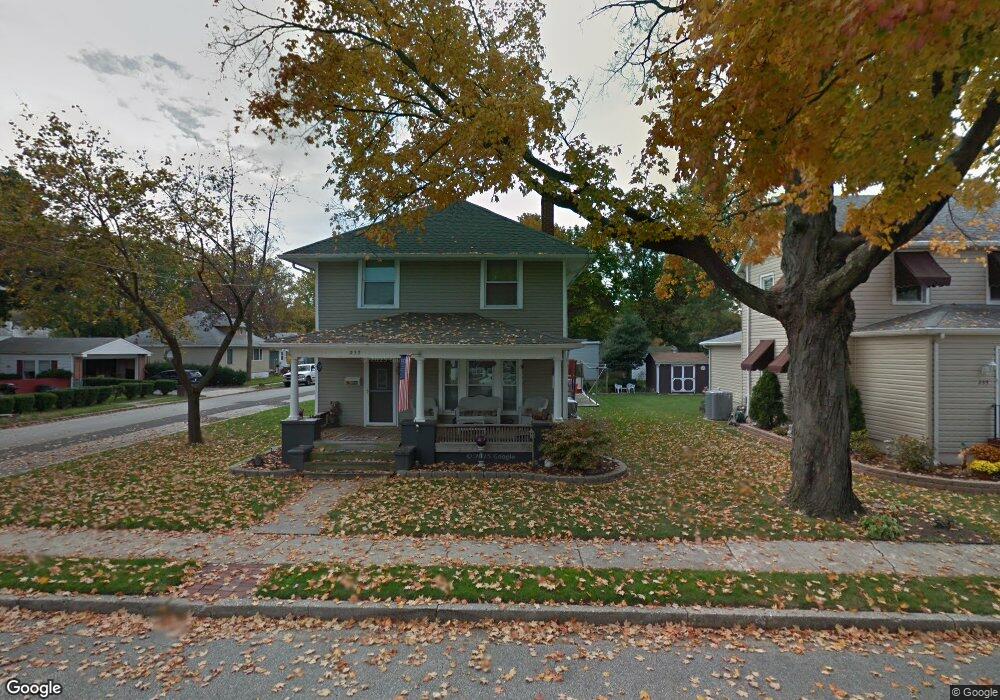
237 Broadway Penns Grove, NJ 08069
Estimated Value: $182,053 - $254,000
--
Bed
--
Bath
1,344
Sq Ft
$168/Sq Ft
Est. Value
About This Home
This home is located at 237 Broadway, Penns Grove, NJ 08069 and is currently estimated at $225,513, approximately $167 per square foot. 237 Broadway is a home located in Salem County with nearby schools including Lafayette-Pershing Elementary School, Paul W. Carleton Elementary School, and Field Street Elementary School.
Ownership History
Date
Name
Owned For
Owner Type
Purchase Details
Closed on
Apr 29, 1999
Sold by
Cummings Gardner B and Mulligan Michael Morris
Bought by
Buckley James G and Stevens Christina L
Current Estimated Value
Home Financials for this Owner
Home Financials are based on the most recent Mortgage that was taken out on this home.
Original Mortgage
$61,452
Outstanding Balance
$15,760
Interest Rate
6.95%
Mortgage Type
FHA
Estimated Equity
$209,753
Create a Home Valuation Report for This Property
The Home Valuation Report is an in-depth analysis detailing your home's value as well as a comparison with similar homes in the area
Home Values in the Area
Average Home Value in this Area
Purchase History
| Date | Buyer | Sale Price | Title Company |
|---|---|---|---|
| Buckley James G | $62,000 | Heritage Title |
Source: Public Records
Mortgage History
| Date | Status | Borrower | Loan Amount |
|---|---|---|---|
| Open | Buckley James G | $61,452 |
Source: Public Records
Tax History Compared to Growth
Tax History
| Year | Tax Paid | Tax Assessment Tax Assessment Total Assessment is a certain percentage of the fair market value that is determined by local assessors to be the total taxable value of land and additions on the property. | Land | Improvement |
|---|---|---|---|---|
| 2025 | $4,498 | $211,800 | $40,400 | $171,400 |
| 2024 | $4,343 | $122,000 | $37,200 | $84,800 |
| 2023 | $4,343 | $122,000 | $37,200 | $84,800 |
| 2022 | $4,087 | $122,000 | $37,200 | $84,800 |
| 2021 | $4,048 | $122,000 | $37,200 | $84,800 |
| 2020 | $4,083 | $122,000 | $37,200 | $84,800 |
| 2019 | $4,118 | $122,000 | $37,200 | $84,800 |
| 2018 | $4,390 | $139,400 | $39,000 | $100,400 |
| 2017 | $4,093 | $139,400 | $39,000 | $100,400 |
| 2016 | $3,881 | $137,200 | $39,000 | $98,200 |
| 2015 | $4,272 | $158,400 | $46,000 | $112,400 |
| 2014 | $4,044 | $158,400 | $46,000 | $112,400 |
Source: Public Records
Map
Nearby Homes