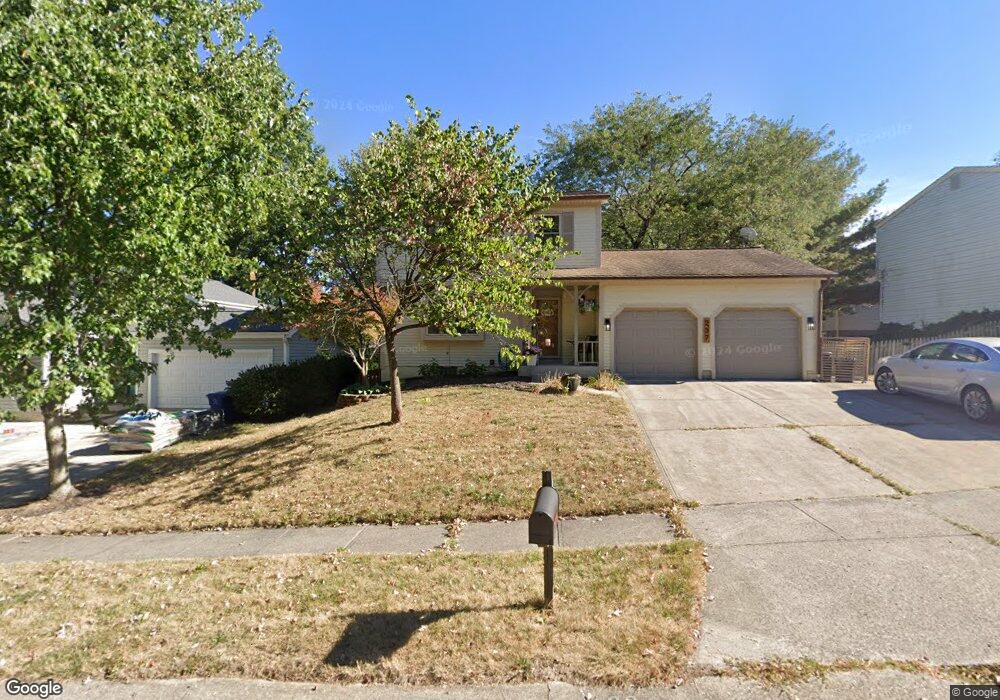
237 Canby Ct Columbus, OH 43230
Woodside Green NeighborhoodEstimated Value: $350,639 - $419,000
3
Beds
2
Baths
1,496
Sq Ft
$258/Sq Ft
Est. Value
About This Home
This home is located at 237 Canby Ct, Columbus, OH 43230 and is currently estimated at $386,160, approximately $258 per square foot. 237 Canby Ct is a home located in Franklin County with nearby schools including Chapelfield Elementary School, Gahanna West Middle School, and Lincoln High School.
Ownership History
Date
Name
Owned For
Owner Type
Purchase Details
Closed on
Sep 23, 2011
Sold by
Rood Patricia A
Bought by
Langhals Matthew C
Current Estimated Value
Home Financials for this Owner
Home Financials are based on the most recent Mortgage that was taken out on this home.
Original Mortgage
$126,400
Outstanding Balance
$86,434
Interest Rate
4.23%
Mortgage Type
New Conventional
Estimated Equity
$299,726
Purchase Details
Closed on
Mar 11, 1987
Bought by
Rood Thomas G
Purchase Details
Closed on
Feb 1, 1986
Create a Home Valuation Report for This Property
The Home Valuation Report is an in-depth analysis detailing your home's value as well as a comparison with similar homes in the area
Home Values in the Area
Average Home Value in this Area
Purchase History
| Date | Buyer | Sale Price | Title Company |
|---|---|---|---|
| Langhals Matthew C | $158,000 | Title First | |
| Rood Thomas G | $81,000 | -- | |
| -- | $29,800 | -- |
Source: Public Records
Mortgage History
| Date | Status | Borrower | Loan Amount |
|---|---|---|---|
| Open | Langhals Matthew C | $126,400 |
Source: Public Records
Tax History Compared to Growth
Tax History
| Year | Tax Paid | Tax Assessment Tax Assessment Total Assessment is a certain percentage of the fair market value that is determined by local assessors to be the total taxable value of land and additions on the property. | Land | Improvement |
|---|---|---|---|---|
| 2024 | $5,988 | $101,640 | $28,700 | $72,940 |
| 2023 | $5,913 | $101,640 | $28,700 | $72,940 |
| 2022 | $5,342 | $71,540 | $18,900 | $52,640 |
| 2021 | $5,167 | $71,540 | $18,900 | $52,640 |
| 2020 | $5,124 | $71,540 | $18,900 | $52,640 |
| 2019 | $4,278 | $59,610 | $15,750 | $43,860 |
| 2018 | $4,028 | $59,610 | $15,750 | $43,860 |
| 2017 | $3,927 | $59,610 | $15,750 | $43,860 |
| 2016 | $3,805 | $52,610 | $13,580 | $39,030 |
| 2015 | $3,808 | $52,610 | $13,580 | $39,030 |
| 2014 | $3,779 | $52,610 | $13,580 | $39,030 |
| 2013 | $1,876 | $52,605 | $13,580 | $39,025 |
Source: Public Records
Map
Nearby Homes
- 402 Bluestem Ave
- 459 Bluestem Ave
- 111 Nob Hill Dr N
- 108 Walcreek Dr W
- 642 Ridenour Rd
- 0 Wendler Blvd
- 200 Glenhurst Ct
- 3544 Halpern St
- 167 Greenbank Rd
- 158 Windrow Ct
- 536 Springwood Lake Dr
- 3555 Tami Place
- 638 Thistle Ave
- 211 Crossing Creek N
- 3954 Stapleford Dr Unit 3954
- 3931 Maidstone Dr
- 3150 Berkley Pointe Dr
- 3877 Hines Rd
- 3118 Berkley Pointe Dr
- 5142 Cherryblossom Way